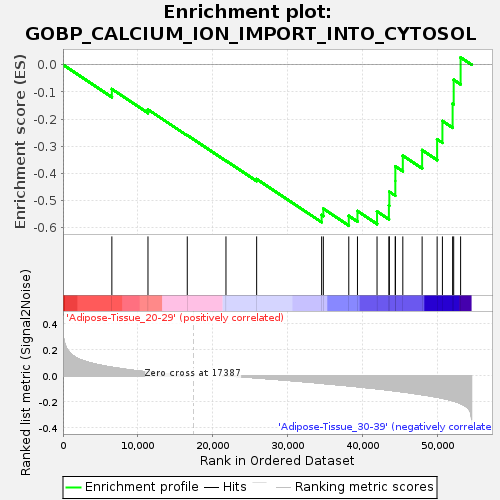
Profile of the Running ES Score & Positions of GeneSet Members on the Rank Ordered List
| Dataset | Adipose-Tissue.Adipose-Tissue.cls #Adipose-Tissue_20-29_versus_Adipose-Tissue_30-39.Adipose-Tissue.cls #Adipose-Tissue_20-29_versus_Adipose-Tissue_30-39_repos |
| Phenotype | Adipose-Tissue.cls#Adipose-Tissue_20-29_versus_Adipose-Tissue_30-39_repos |
| Upregulated in class | Adipose-Tissue_30-39 |
| GeneSet | GOBP_CALCIUM_ION_IMPORT_INTO_CYTOSOL |
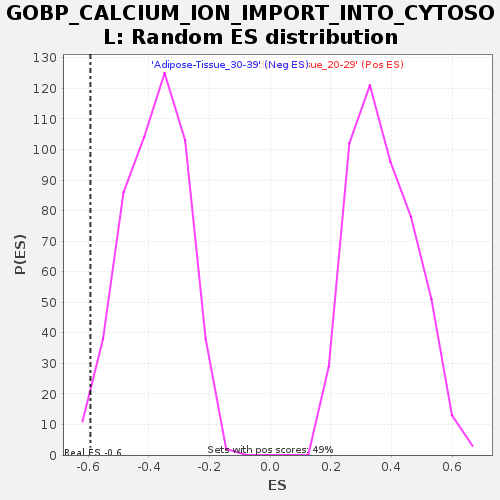
| Enrichment Score (ES) | -0.5925287 |
| Normalized Enrichment Score (NES) | -1.5604756 |
| Nominal p-value | 0.01775148 |
| FDR q-value | 0.8935607 |
| FWER p-Value | 0.93 |

| SYMBOL | TITLE | RANK IN GENE LIST | RANK METRIC SCORE | RUNNING ES | CORE ENRICHMENT | |
|---|---|---|---|---|---|---|
| 1 | SLC24A2 | NA | 6528 | 0.065 | -0.0897 | No |
| 2 | SLC8A2 | NA | 11354 | 0.028 | -0.1651 | No |
| 3 | PRNP | NA | 16604 | 0.003 | -0.2598 | No |
| 4 | FAM155A | NA | 21774 | -0.002 | -0.3537 | No |
| 5 | ATP2B4 | NA | 25874 | -0.016 | -0.4212 | No |
| 6 | TRPV6 | NA | 34557 | -0.058 | -0.5535 | No |
| 7 | TRPV4 | NA | 34784 | -0.059 | -0.5302 | No |
| 8 | TRPV5 | NA | 38184 | -0.077 | -0.5567 | Yes |
| 9 | TRPV3 | NA | 39344 | -0.084 | -0.5390 | Yes |
| 10 | SLC8A1 | NA | 41960 | -0.100 | -0.5405 | Yes |
| 11 | FAM155B | NA | 43545 | -0.111 | -0.5182 | Yes |
| 12 | FYN | NA | 43603 | -0.111 | -0.4678 | Yes |
| 13 | RAMP3 | NA | 44403 | -0.117 | -0.4283 | Yes |
| 14 | MS4A1 | NA | 44405 | -0.117 | -0.3742 | Yes |
| 15 | TRPV1 | NA | 45404 | -0.124 | -0.3349 | Yes |
| 16 | TRPV2 | NA | 47984 | -0.146 | -0.3145 | Yes |
| 17 | CACNA2D1 | NA | 49989 | -0.165 | -0.2747 | Yes |
| 18 | TRPM2 | NA | 50695 | -0.173 | -0.2074 | Yes |
| 19 | CALCR | NA | 52058 | -0.192 | -0.1431 | Yes |
| 20 | SLC8A3 | NA | 52201 | -0.195 | -0.0554 | Yes |
| 21 | SLC24A1 | NA | 53126 | -0.214 | 0.0268 | Yes |

