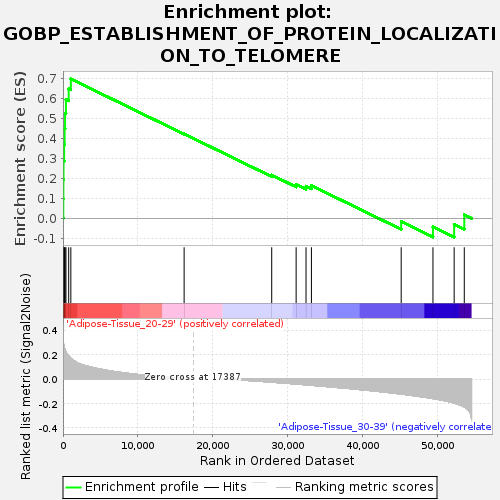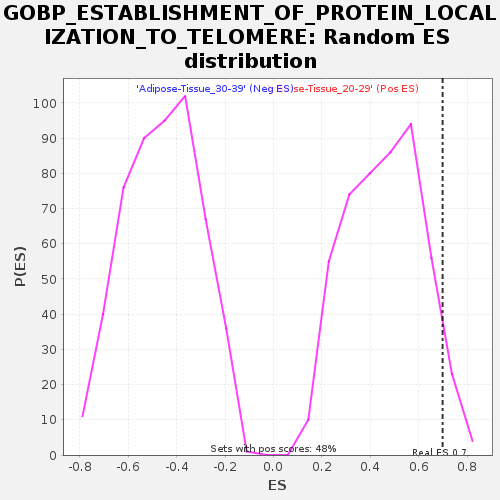
Profile of the Running ES Score & Positions of GeneSet Members on the Rank Ordered List
| Dataset | Adipose-Tissue.Adipose-Tissue.cls #Adipose-Tissue_20-29_versus_Adipose-Tissue_30-39.Adipose-Tissue.cls #Adipose-Tissue_20-29_versus_Adipose-Tissue_30-39_repos |
| Phenotype | Adipose-Tissue.cls#Adipose-Tissue_20-29_versus_Adipose-Tissue_30-39_repos |
| Upregulated in class | Adipose-Tissue_20-29 |
| GeneSet | GOBP_ESTABLISHMENT_OF_PROTEIN_LOCALIZATION_TO_TELOMERE |
| Enrichment Score (ES) | 0.6990878 |
| Normalized Enrichment Score (NES) | 1.525132 |
| Nominal p-value | 0.056016598 |
| FDR q-value | 0.4632857 |
| FWER p-Value | 0.944 |

| SYMBOL | TITLE | RANK IN GENE LIST | RANK METRIC SCORE | RUNNING ES | CORE ENRICHMENT | |
|---|---|---|---|---|---|---|
| 1 | CCT5 | NA | 39 | 0.306 | 0.0980 | Yes |
| 2 | CCT2 | NA | 50 | 0.299 | 0.1943 | Yes |
| 3 | CCT3 | NA | 71 | 0.290 | 0.2875 | Yes |
| 4 | CCT7 | NA | 153 | 0.262 | 0.3705 | Yes |
| 5 | CCT6A | NA | 215 | 0.251 | 0.4504 | Yes |
| 6 | DKC1 | NA | 279 | 0.240 | 0.5267 | Yes |
| 7 | CCT4 | NA | 395 | 0.220 | 0.5958 | Yes |
| 8 | TCP1 | NA | 760 | 0.188 | 0.6498 | Yes |
| 9 | CCT8 | NA | 1047 | 0.169 | 0.6991 | Yes |
| 10 | TERT | NA | 16183 | 0.005 | 0.4233 | No |
| 11 | WRAP53 | NA | 27887 | -0.025 | 0.2169 | No |
| 12 | NABP2 | NA | 31149 | -0.040 | 0.1702 | No |
| 13 | ATR | NA | 32471 | -0.047 | 0.1611 | No |
| 14 | BRCA2 | NA | 33192 | -0.050 | 0.1642 | No |
| 15 | TERF1 | NA | 45186 | -0.123 | -0.0160 | No |
| 16 | ACD | NA | 49432 | -0.159 | -0.0424 | No |
| 17 | POT1 | NA | 52264 | -0.196 | -0.0311 | No |
| 18 | ATM | NA | 53616 | -0.228 | 0.0179 | No |

