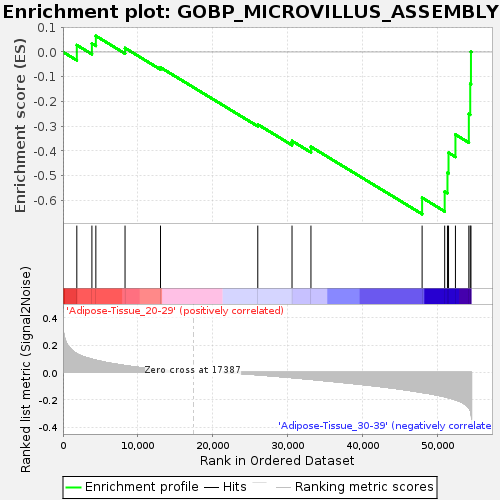
Profile of the Running ES Score & Positions of GeneSet Members on the Rank Ordered List
| Dataset | Adipose-Tissue.Adipose-Tissue.cls #Adipose-Tissue_20-29_versus_Adipose-Tissue_30-39.Adipose-Tissue.cls #Adipose-Tissue_20-29_versus_Adipose-Tissue_30-39_repos |
| Phenotype | Adipose-Tissue.cls#Adipose-Tissue_20-29_versus_Adipose-Tissue_30-39_repos |
| Upregulated in class | Adipose-Tissue_30-39 |
| GeneSet | GOBP_MICROVILLUS_ASSEMBLY |
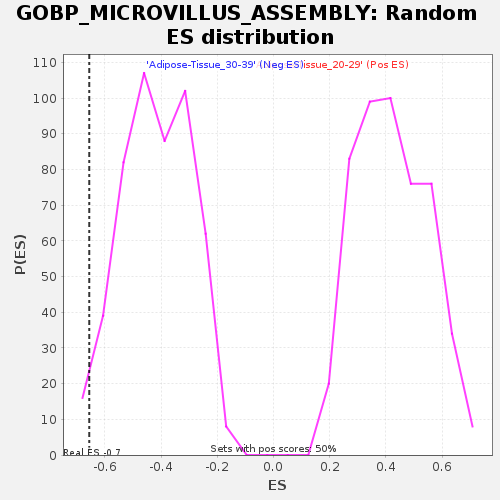
| Enrichment Score (ES) | -0.65524703 |
| Normalized Enrichment Score (NES) | -1.5718598 |
| Nominal p-value | 0.023809524 |
| FDR q-value | 0.94467956 |
| FWER p-Value | 0.924 |

| SYMBOL | TITLE | RANK IN GENE LIST | RANK METRIC SCORE | RUNNING ES | CORE ENRICHMENT | |
|---|---|---|---|---|---|---|
| 1 | SLC9A3R1 | NA | 1846 | 0.136 | 0.0278 | No |
| 2 | KLF5 | NA | 3862 | 0.096 | 0.0344 | No |
| 3 | EZR | NA | 4389 | 0.088 | 0.0649 | No |
| 4 | STK26 | NA | 8289 | 0.049 | 0.0159 | No |
| 5 | RAP1GAP | NA | 13028 | 0.019 | -0.0624 | No |
| 6 | ESPN | NA | 26025 | -0.017 | -0.2928 | No |
| 7 | FSCN1 | NA | 30600 | -0.038 | -0.3595 | No |
| 8 | PODXL | NA | 33129 | -0.050 | -0.3831 | No |
| 9 | RAPGEF6 | NA | 47982 | -0.146 | -0.5891 | Yes |
| 10 | ATP8B1 | NA | 50998 | -0.177 | -0.5640 | Yes |
| 11 | TNIK | NA | 51370 | -0.182 | -0.4882 | Yes |
| 12 | FXYD5 | NA | 51512 | -0.184 | -0.4072 | Yes |
| 13 | RAPGEF2 | NA | 52435 | -0.199 | -0.3337 | Yes |
| 14 | PLD1 | NA | 54226 | -0.256 | -0.2505 | Yes |
| 15 | MYO1A | NA | 54411 | -0.275 | -0.1291 | Yes |
| 16 | RAP2A | NA | 54509 | -0.292 | 0.0015 | Yes |

