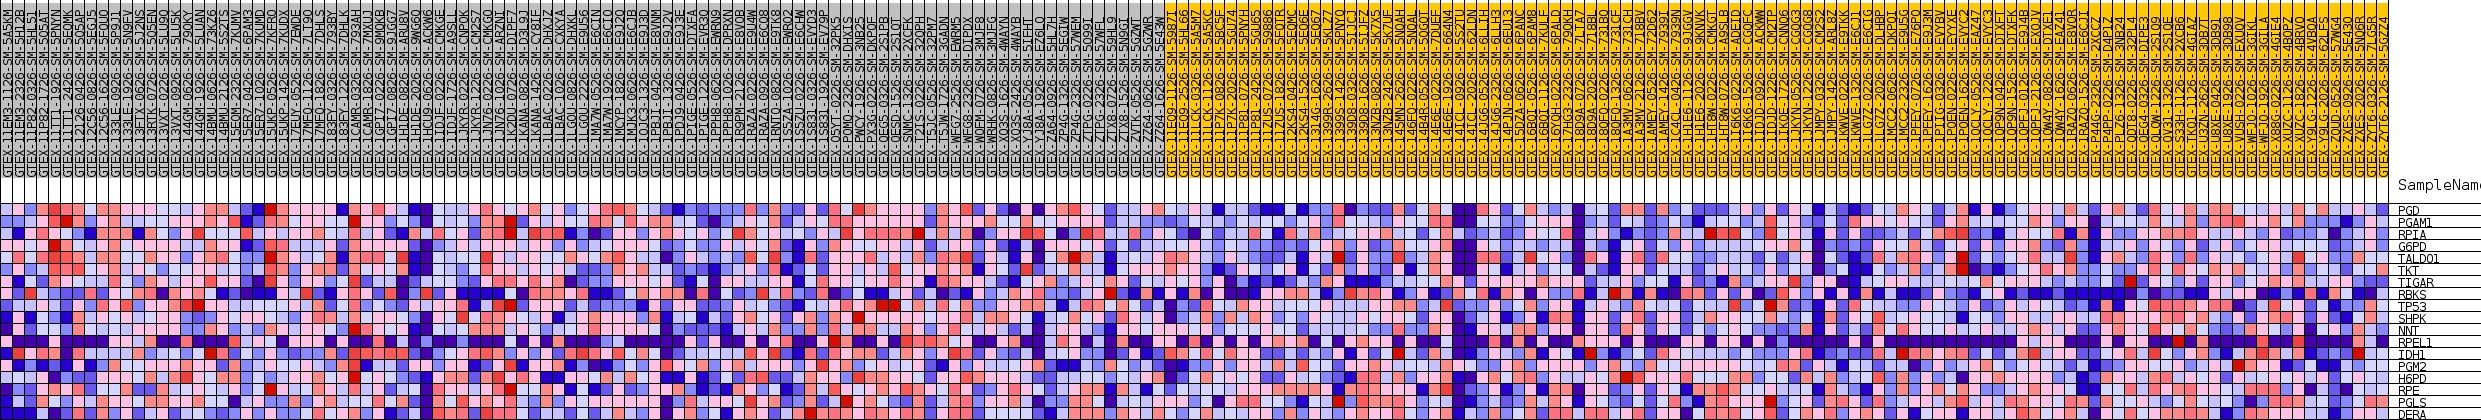
Profile of the Running ES Score & Positions of GeneSet Members on the Rank Ordered List
| Dataset | Adipose-Tissue.Adipose-Tissue.cls #Adipose-Tissue_20-29_versus_Adipose-Tissue_30-39.Adipose-Tissue.cls #Adipose-Tissue_20-29_versus_Adipose-Tissue_30-39_repos |
| Phenotype | Adipose-Tissue.cls#Adipose-Tissue_20-29_versus_Adipose-Tissue_30-39_repos |
| Upregulated in class | Adipose-Tissue_20-29 |
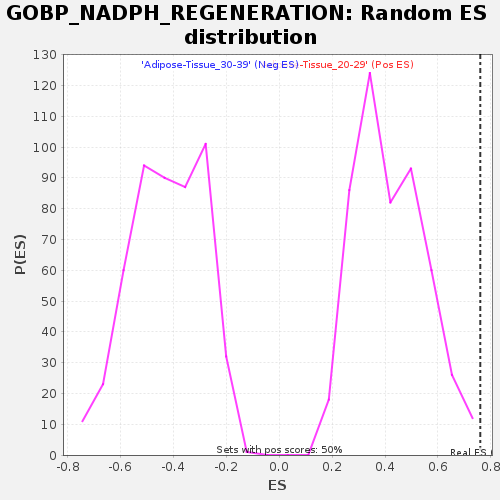
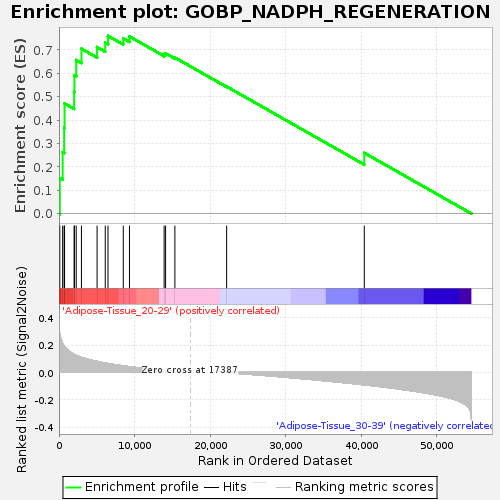
| GeneSet | GOBP_NADPH_REGENERATION |
| Enrichment Score (ES) | 0.7598494 |
| Normalized Enrichment Score (NES) | 1.8178413 |
| Nominal p-value | 0.003992016 |
| FDR q-value | 0.7221197 |
| FWER p-Value | 0.383 |
| SYMBOL | TITLE | RANK IN GENE LIST | RANK METRIC SCORE | RUNNING ES | CORE ENRICHMENT | |
|---|---|---|---|---|---|---|
| 1 | PGD | NA | 103 | 0.277 | 0.1524 | Yes |
| 2 | PGAM1 | NA | 484 | 0.211 | 0.2626 | Yes |
| 3 | RPIA | NA | 681 | 0.193 | 0.3665 | Yes |
| 4 | G6PD | NA | 734 | 0.190 | 0.4711 | Yes |
| 5 | TALDO1 | NA | 2003 | 0.131 | 0.5206 | Yes |
| 6 | TKT | NA | 2040 | 0.129 | 0.5919 | Yes |
| 7 | TIGAR | NA | 2280 | 0.124 | 0.6564 | Yes |
| 8 | RBKS | NA | 2970 | 0.110 | 0.7051 | Yes |
| 9 | TP53 | NA | 5041 | 0.081 | 0.7120 | Yes |
| 10 | SHPK | NA | 6122 | 0.069 | 0.7303 | Yes |
| 11 | NNT | NA | 6486 | 0.065 | 0.7598 | Yes |
| 12 | RPEL1 | NA | 8507 | 0.048 | 0.7494 | No |
| 13 | IDH1 | NA | 9327 | 0.042 | 0.7575 | No |
| 14 | PGM2 | NA | 13917 | 0.014 | 0.6813 | No |
| 15 | H6PD | NA | 14111 | 0.013 | 0.6853 | No |
| 16 | RPE | NA | 15340 | 0.008 | 0.6672 | No |
| 17 | PGLS | NA | 22192 | -0.003 | 0.5433 | No |
| 18 | DERA | NA | 40414 | -0.090 | 0.2598 | No |