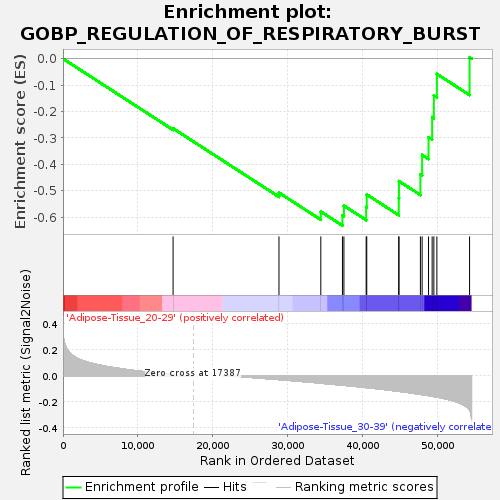
Profile of the Running ES Score & Positions of GeneSet Members on the Rank Ordered List
| Dataset | Adipose-Tissue.Adipose-Tissue.cls #Adipose-Tissue_20-29_versus_Adipose-Tissue_30-39.Adipose-Tissue.cls #Adipose-Tissue_20-29_versus_Adipose-Tissue_30-39_repos |
| Phenotype | Adipose-Tissue.cls#Adipose-Tissue_20-29_versus_Adipose-Tissue_30-39_repos |
| Upregulated in class | Adipose-Tissue_30-39 |
| GeneSet | GOBP_REGULATION_OF_RESPIRATORY_BURST |
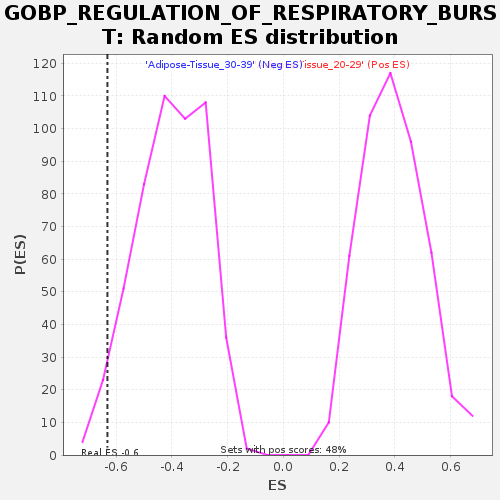
| Enrichment Score (ES) | -0.6315722 |
| Normalized Enrichment Score (NES) | -1.569327 |
| Nominal p-value | 0.036538463 |
| FDR q-value | 0.93396187 |
| FWER p-Value | 0.926 |

| SYMBOL | TITLE | RANK IN GENE LIST | RANK METRIC SCORE | RUNNING ES | CORE ENRICHMENT | |
|---|---|---|---|---|---|---|
| 1 | RPS19 | NA | 14709 | 0.011 | -0.2637 | No |
| 2 | LBP | NA | 28856 | -0.030 | -0.5070 | No |
| 3 | NOXO1 | NA | 34447 | -0.057 | -0.5786 | No |
| 4 | INS | NA | 37337 | -0.073 | -0.5924 | Yes |
| 5 | INSR | NA | 37534 | -0.074 | -0.5563 | Yes |
| 6 | DUSP10 | NA | 40505 | -0.091 | -0.5618 | Yes |
| 7 | IGHA1 | NA | 40586 | -0.092 | -0.5139 | Yes |
| 8 | JCHAIN | NA | 44863 | -0.120 | -0.5276 | Yes |
| 9 | IGHA2 | NA | 44889 | -0.120 | -0.4633 | Yes |
| 10 | RAC1 | NA | 47753 | -0.144 | -0.4385 | Yes |
| 11 | SLAMF8 | NA | 47985 | -0.146 | -0.3642 | Yes |
| 12 | CAMK1D | NA | 48840 | -0.153 | -0.2973 | Yes |
| 13 | GRN | NA | 49323 | -0.158 | -0.2210 | Yes |
| 14 | RAC2 | NA | 49553 | -0.160 | -0.1389 | Yes |
| 15 | CLEC7A | NA | 49956 | -0.165 | -0.0577 | Yes |
| 16 | NOXA1 | NA | 54324 | -0.265 | 0.0049 | Yes |

