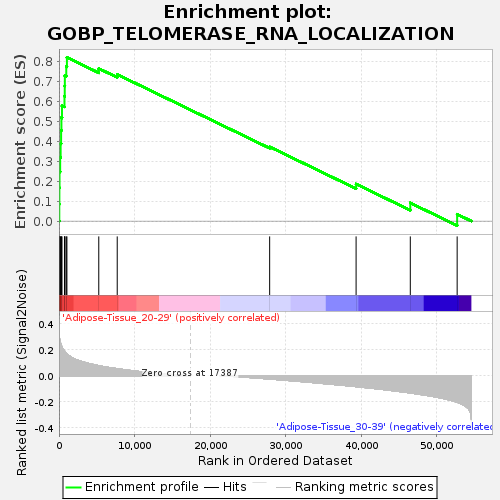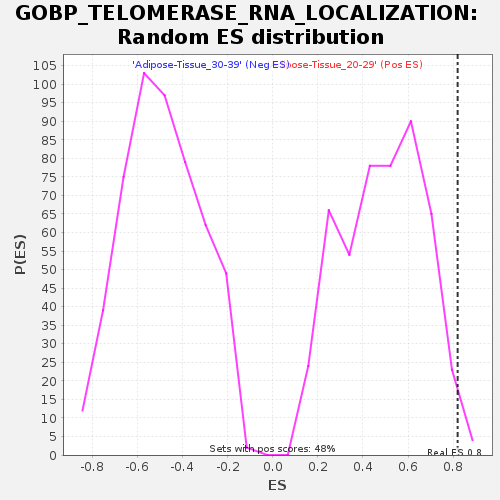
Profile of the Running ES Score & Positions of GeneSet Members on the Rank Ordered List
| Dataset | Adipose-Tissue.Adipose-Tissue.cls #Adipose-Tissue_20-29_versus_Adipose-Tissue_30-39.Adipose-Tissue.cls #Adipose-Tissue_20-29_versus_Adipose-Tissue_30-39_repos |
| Phenotype | Adipose-Tissue.cls#Adipose-Tissue_20-29_versus_Adipose-Tissue_30-39_repos |
| Upregulated in class | Adipose-Tissue_20-29 |
| GeneSet | GOBP_TELOMERASE_RNA_LOCALIZATION |
| Enrichment Score (ES) | 0.8198694 |
| Normalized Enrichment Score (NES) | 1.6740847 |
| Nominal p-value | 0.010373444 |
| FDR q-value | 0.24076506 |
| FWER p-Value | 0.792 |

| SYMBOL | TITLE | RANK IN GENE LIST | RANK METRIC SCORE | RUNNING ES | CORE ENRICHMENT | |
|---|---|---|---|---|---|---|
| 1 | CCT5 | NA | 39 | 0.306 | 0.0845 | Yes |
| 2 | CCT2 | NA | 50 | 0.299 | 0.1676 | Yes |
| 3 | CCT3 | NA | 71 | 0.290 | 0.2480 | Yes |
| 4 | CCT7 | NA | 153 | 0.262 | 0.3195 | Yes |
| 5 | CCT6A | NA | 215 | 0.251 | 0.3882 | Yes |
| 6 | DKC1 | NA | 279 | 0.240 | 0.4540 | Yes |
| 7 | NHP2 | NA | 320 | 0.233 | 0.5183 | Yes |
| 8 | CCT4 | NA | 395 | 0.220 | 0.5784 | Yes |
| 9 | RUVBL1 | NA | 726 | 0.190 | 0.6254 | Yes |
| 10 | TCP1 | NA | 760 | 0.188 | 0.6772 | Yes |
| 11 | NOP10 | NA | 774 | 0.187 | 0.7291 | Yes |
| 12 | RUVBL2 | NA | 962 | 0.175 | 0.7744 | Yes |
| 13 | CCT8 | NA | 1047 | 0.169 | 0.8199 | Yes |
| 14 | SHQ1 | NA | 5265 | 0.078 | 0.7643 | No |
| 15 | NAF1 | NA | 7707 | 0.054 | 0.7347 | No |
| 16 | WRAP53 | NA | 27887 | -0.025 | 0.3719 | No |
| 17 | EXOSC10 | NA | 39329 | -0.084 | 0.1857 | No |
| 18 | PARN | NA | 46505 | -0.133 | 0.0912 | No |
| 19 | DCP2 | NA | 52707 | -0.204 | 0.0345 | No |

