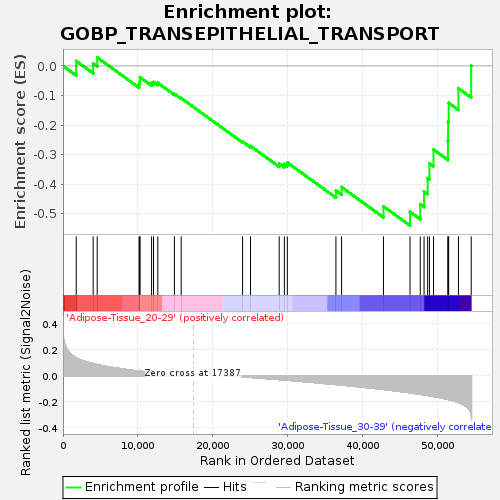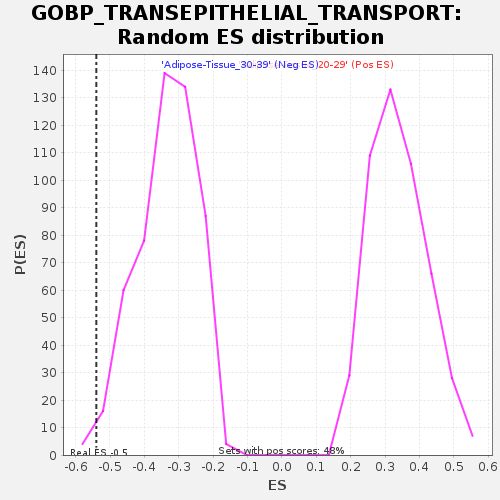
Profile of the Running ES Score & Positions of GeneSet Members on the Rank Ordered List
| Dataset | Adipose-Tissue.Adipose-Tissue.cls #Adipose-Tissue_20-29_versus_Adipose-Tissue_30-39.Adipose-Tissue.cls #Adipose-Tissue_20-29_versus_Adipose-Tissue_30-39_repos |
| Phenotype | Adipose-Tissue.cls#Adipose-Tissue_20-29_versus_Adipose-Tissue_30-39_repos |
| Upregulated in class | Adipose-Tissue_30-39 |
| GeneSet | GOBP_TRANSEPITHELIAL_TRANSPORT |
| Enrichment Score (ES) | -0.53978485 |
| Normalized Enrichment Score (NES) | -1.6180665 |
| Nominal p-value | 0.011494253 |
| FDR q-value | 1.0 |
| FWER p-Value | 0.87 |

| SYMBOL | TITLE | RANK IN GENE LIST | RANK METRIC SCORE | RUNNING ES | CORE ENRICHMENT | |
|---|---|---|---|---|---|---|
| 1 | SLC1A3 | NA | 1765 | 0.138 | 0.0166 | No |
| 2 | RHCG | NA | 4030 | 0.094 | 0.0082 | No |
| 3 | AHCYL1 | NA | 4569 | 0.086 | 0.0289 | No |
| 4 | RHBG | NA | 10159 | 0.036 | -0.0608 | No |
| 5 | EDNRB | NA | 10268 | 0.035 | -0.0504 | No |
| 6 | ACTB | NA | 10273 | 0.035 | -0.0381 | No |
| 7 | SLC1A2 | NA | 11836 | 0.025 | -0.0577 | No |
| 8 | ACTG1 | NA | 12093 | 0.024 | -0.0540 | No |
| 9 | CXADR | NA | 12668 | 0.020 | -0.0573 | No |
| 10 | CLDN19 | NA | 14886 | 0.010 | -0.0944 | No |
| 11 | CFTR | NA | 15792 | 0.006 | -0.1088 | No |
| 12 | EDN1 | NA | 23993 | -0.009 | -0.2559 | No |
| 13 | CSF2 | NA | 25053 | -0.013 | -0.2708 | No |
| 14 | CLDN3 | NA | 28886 | -0.030 | -0.3305 | No |
| 15 | SLC5A1 | NA | 29578 | -0.033 | -0.3314 | No |
| 16 | BEST1 | NA | 29972 | -0.035 | -0.3263 | No |
| 17 | ABCC1 | NA | 36465 | -0.068 | -0.4213 | No |
| 18 | ABCB1 | NA | 37223 | -0.072 | -0.4096 | No |
| 19 | GPLD1 | NA | 42817 | -0.106 | -0.4747 | No |
| 20 | SLC12A2 | NA | 46367 | -0.132 | -0.4932 | Yes |
| 21 | ABCC2 | NA | 47735 | -0.143 | -0.4676 | Yes |
| 22 | P2RY4 | NA | 48242 | -0.148 | -0.4245 | Yes |
| 23 | ITPR1 | NA | 48720 | -0.152 | -0.3795 | Yes |
| 24 | SCNN1B | NA | 48962 | -0.154 | -0.3293 | Yes |
| 25 | SLC26A6 | NA | 49504 | -0.160 | -0.2826 | Yes |
| 26 | SLC1A1 | NA | 51434 | -0.183 | -0.2532 | Yes |
| 27 | SLC23A1 | NA | 51453 | -0.183 | -0.1886 | Yes |
| 28 | AQP1 | NA | 51530 | -0.184 | -0.1248 | Yes |
| 29 | SLC23A2 | NA | 52835 | -0.207 | -0.0755 | Yes |
| 30 | ABCG2 | NA | 54543 | -0.304 | 0.0009 | Yes |

