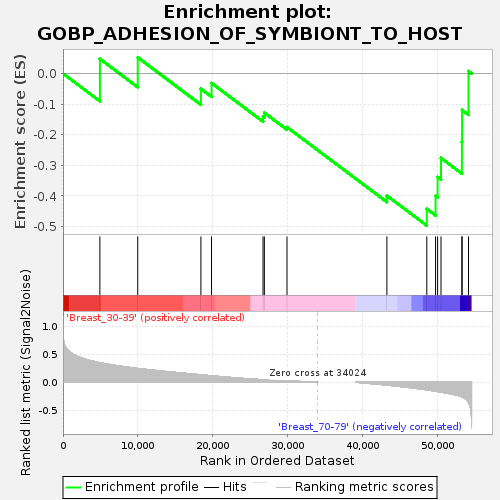
Profile of the Running ES Score & Positions of GeneSet Members on the Rank Ordered List
| Dataset | Breast.Breast.cls #Breast_30-39_versus_Breast_70-79.Breast.cls #Breast_30-39_versus_Breast_70-79_repos |
| Phenotype | Breast.cls#Breast_30-39_versus_Breast_70-79_repos |
| Upregulated in class | Breast_70-79 |
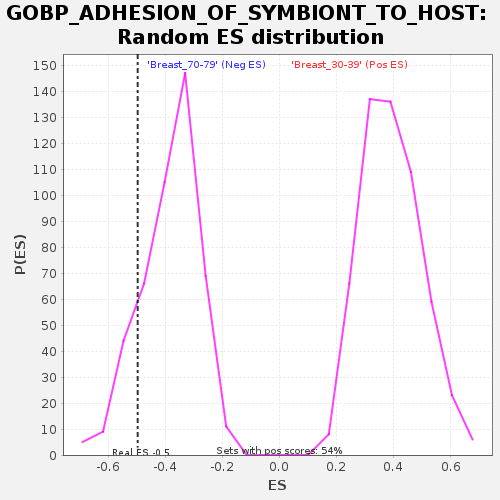
| GeneSet | GOBP_ADHESION_OF_SYMBIONT_TO_HOST |
| Enrichment Score (ES) | -0.49675104 |
| Normalized Enrichment Score (NES) | -1.2976042 |
| Nominal p-value | 0.1513158 |
| FDR q-value | 1.0 |
| FWER p-Value | 0.998 |
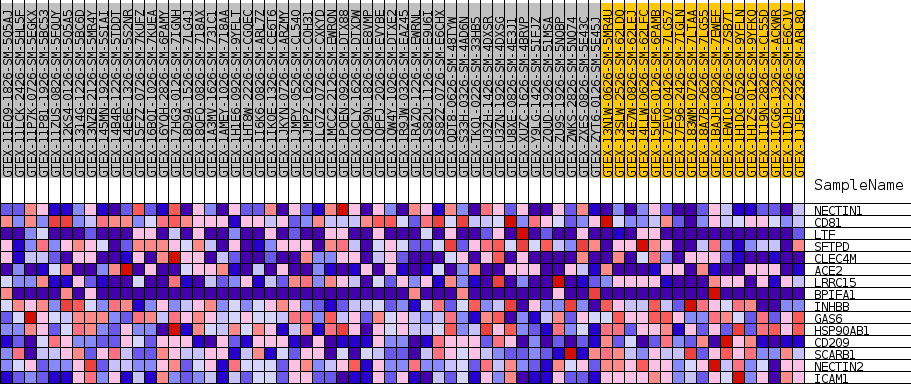
| SYMBOL | TITLE | RANK IN GENE LIST | RANK METRIC SCORE | RUNNING ES | CORE ENRICHMENT | |
|---|---|---|---|---|---|---|
| 1 | NECTIN1 | NA | 4928 | 0.347 | 0.0478 | No |
| 2 | CD81 | NA | 9987 | 0.245 | 0.0523 | No |
| 3 | LTF | NA | 18426 | 0.131 | -0.0502 | No |
| 4 | SFTPD | NA | 19846 | 0.113 | -0.0313 | No |
| 5 | CLEC4M | NA | 26727 | 0.042 | -0.1408 | No |
| 6 | ACE2 | NA | 26904 | 0.040 | -0.1281 | No |
| 7 | LRRC15 | NA | 29929 | 0.021 | -0.1753 | No |
| 8 | BPIFA1 | NA | 43275 | -0.052 | -0.3991 | No |
| 9 | INHBB | NA | 48608 | -0.137 | -0.4423 | Yes |
| 10 | GAS6 | NA | 49780 | -0.161 | -0.3996 | Yes |
| 11 | HSP90AB1 | NA | 50052 | -0.168 | -0.3379 | Yes |
| 12 | CD209 | NA | 50507 | -0.177 | -0.2759 | Yes |
| 13 | SCARB1 | NA | 53302 | -0.261 | -0.2233 | Yes |
| 14 | NECTIN2 | NA | 53322 | -0.262 | -0.1193 | Yes |
| 15 | ICAM1 | NA | 54181 | -0.359 | 0.0075 | Yes |