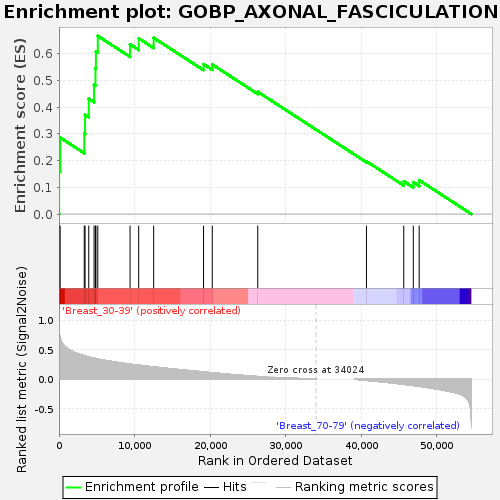
Profile of the Running ES Score & Positions of GeneSet Members on the Rank Ordered List
| Dataset | Breast.Breast.cls #Breast_30-39_versus_Breast_70-79.Breast.cls #Breast_30-39_versus_Breast_70-79_repos |
| Phenotype | Breast.cls#Breast_30-39_versus_Breast_70-79_repos |
| Upregulated in class | Breast_30-39 |
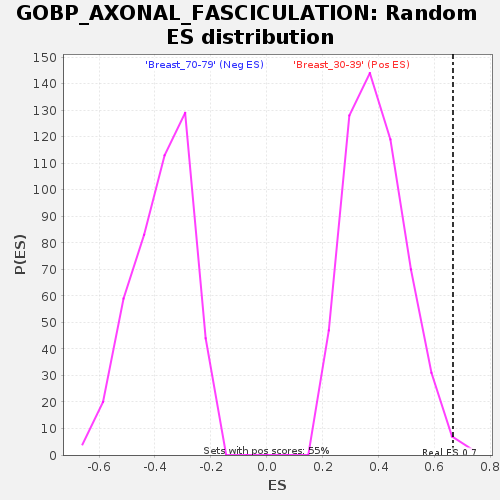
| GeneSet | GOBP_AXONAL_FASCICULATION |
| Enrichment Score (ES) | 0.6661912 |
| Normalized Enrichment Score (NES) | 1.7067189 |
| Nominal p-value | 0.0054744524 |
| FDR q-value | 0.37469044 |
| FWER p-Value | 0.63 |
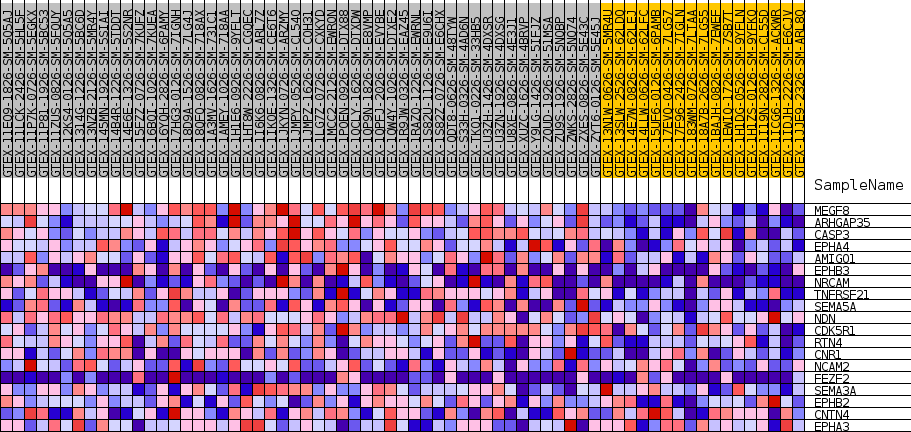
| SYMBOL | TITLE | RANK IN GENE LIST | RANK METRIC SCORE | RUNNING ES | CORE ENRICHMENT | |
|---|---|---|---|---|---|---|
| 1 | MEGF8 | NA | 14 | 0.872 | 0.1604 | Yes |
| 2 | ARHGAP35 | NA | 153 | 0.696 | 0.2860 | Yes |
| 3 | CASP3 | NA | 3340 | 0.397 | 0.3006 | Yes |
| 4 | EPHA4 | NA | 3452 | 0.393 | 0.3709 | Yes |
| 5 | AMIGO1 | NA | 3939 | 0.376 | 0.4311 | Yes |
| 6 | EPHB3 | NA | 4642 | 0.355 | 0.4836 | Yes |
| 7 | NRCAM | NA | 4827 | 0.350 | 0.5447 | Yes |
| 8 | TNFRSF21 | NA | 4888 | 0.348 | 0.6077 | Yes |
| 9 | SEMA5A | NA | 5134 | 0.342 | 0.6662 | Yes |
| 10 | NDN | NA | 9406 | 0.254 | 0.6347 | No |
| 11 | CDK5R1 | NA | 10549 | 0.236 | 0.6572 | No |
| 12 | RTN4 | NA | 12532 | 0.207 | 0.6590 | No |
| 13 | CNR1 | NA | 19137 | 0.122 | 0.5605 | No |
| 14 | NCAM2 | NA | 20290 | 0.108 | 0.5592 | No |
| 15 | FEZF2 | NA | 26312 | 0.045 | 0.4572 | No |
| 16 | SEMA3A | NA | 40702 | -0.020 | 0.1972 | No |
| 17 | EPHB2 | NA | 45638 | -0.086 | 0.1226 | No |
| 18 | CNTN4 | NA | 46902 | -0.106 | 0.1189 | No |
| 19 | EPHA3 | NA | 47680 | -0.120 | 0.1266 | No |