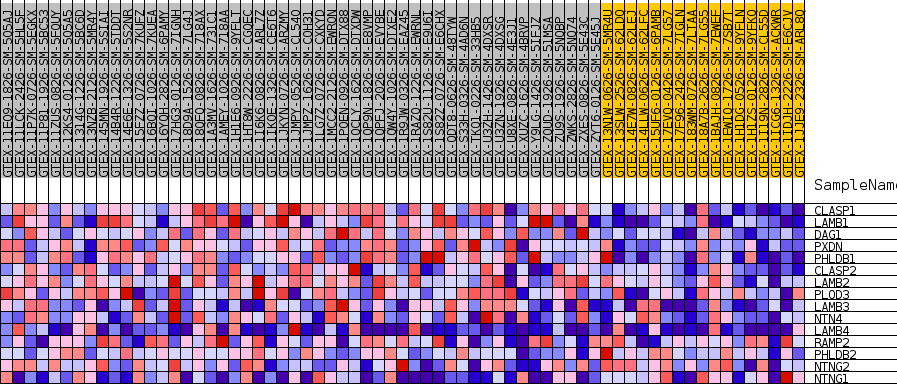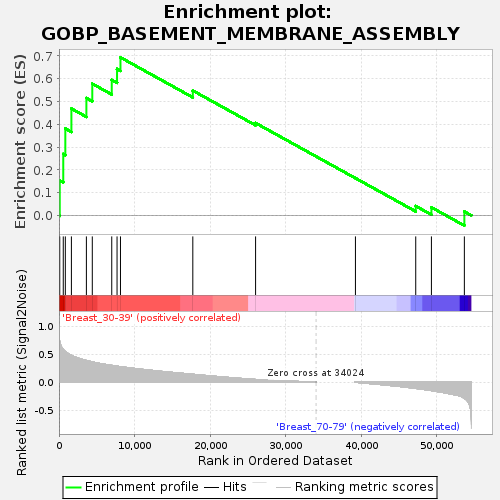
Profile of the Running ES Score & Positions of GeneSet Members on the Rank Ordered List
| Dataset | Breast.Breast.cls #Breast_30-39_versus_Breast_70-79.Breast.cls #Breast_30-39_versus_Breast_70-79_repos |
| Phenotype | Breast.cls#Breast_30-39_versus_Breast_70-79_repos |
| Upregulated in class | Breast_30-39 |
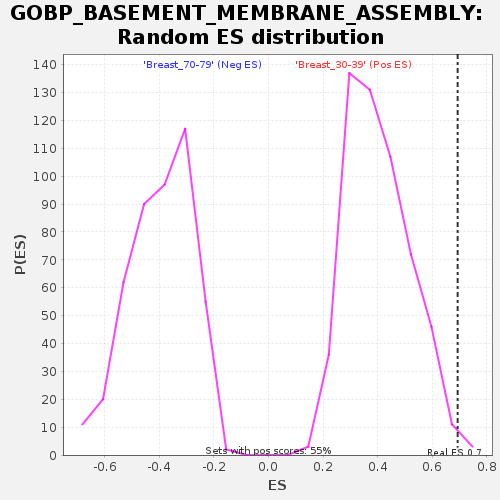
| GeneSet | GOBP_BASEMENT_MEMBRANE_ASSEMBLY |
| Enrichment Score (ES) | 0.6930893 |
| Normalized Enrichment Score (NES) | 1.7203332 |
| Nominal p-value | 0.0054945056 |
| FDR q-value | 0.42720968 |
| FWER p-Value | 0.588 |
| SYMBOL | TITLE | RANK IN GENE LIST | RANK METRIC SCORE | RUNNING ES | CORE ENRICHMENT | |
|---|---|---|---|---|---|---|
| 1 | CLASP1 | NA | 98 | 0.728 | 0.1535 | Yes |
| 2 | LAMB1 | NA | 564 | 0.583 | 0.2693 | Yes |
| 3 | DAG1 | NA | 837 | 0.547 | 0.3811 | Yes |
| 4 | PXDN | NA | 1641 | 0.479 | 0.4686 | Yes |
| 5 | PHLDB1 | NA | 3625 | 0.387 | 0.5147 | Yes |
| 6 | CLASP2 | NA | 4407 | 0.362 | 0.5777 | Yes |
| 7 | LAMB2 | NA | 6983 | 0.299 | 0.5944 | Yes |
| 8 | PLOD3 | NA | 7684 | 0.285 | 0.6424 | Yes |
| 9 | LAMB3 | NA | 8137 | 0.276 | 0.6931 | Yes |
| 10 | NTN4 | NA | 17714 | 0.140 | 0.5476 | No |
| 11 | LAMB4 | NA | 26024 | 0.047 | 0.4055 | No |
| 12 | RAMP2 | NA | 39242 | -0.002 | 0.1637 | No |
| 13 | PHLDB2 | NA | 47224 | -0.111 | 0.0412 | No |
| 14 | NTNG2 | NA | 49300 | -0.151 | 0.0354 | No |
| 15 | NTNG1 | NA | 53661 | -0.288 | 0.0170 | No |