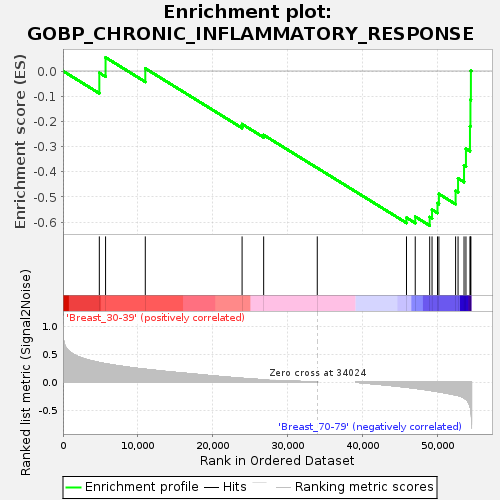
Profile of the Running ES Score & Positions of GeneSet Members on the Rank Ordered List
| Dataset | Breast.Breast.cls #Breast_30-39_versus_Breast_70-79.Breast.cls #Breast_30-39_versus_Breast_70-79_repos |
| Phenotype | Breast.cls#Breast_30-39_versus_Breast_70-79_repos |
| Upregulated in class | Breast_70-79 |
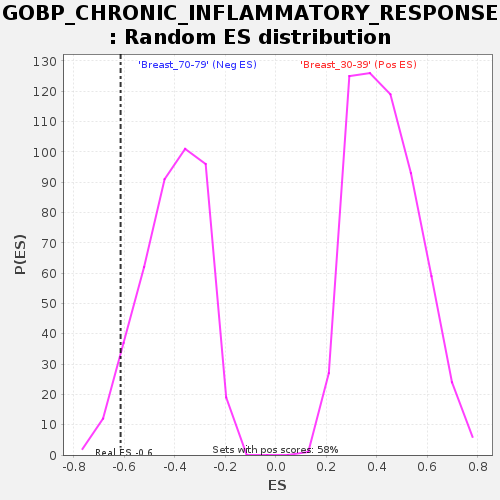
| GeneSet | GOBP_CHRONIC_INFLAMMATORY_RESPONSE |
| Enrichment Score (ES) | -0.6140542 |
| Normalized Enrichment Score (NES) | -1.494421 |
| Nominal p-value | 0.07857143 |
| FDR q-value | 0.7576289 |
| FWER p-Value | 0.965 |
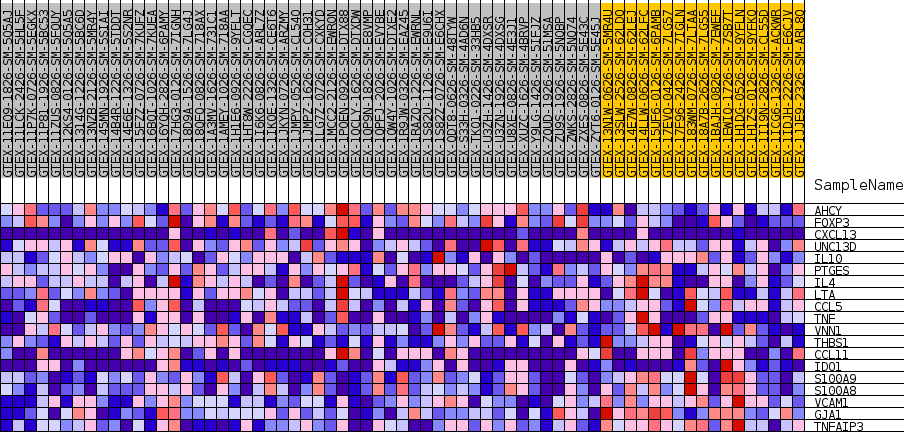
| SYMBOL | TITLE | RANK IN GENE LIST | RANK METRIC SCORE | RUNNING ES | CORE ENRICHMENT | |
|---|---|---|---|---|---|---|
| 1 | AHCY | NA | 4853 | 0.349 | -0.0073 | No |
| 2 | FOXP3 | NA | 5687 | 0.328 | 0.0540 | No |
| 3 | CXCL13 | NA | 10995 | 0.229 | 0.0103 | No |
| 4 | UNC13D | NA | 23928 | 0.068 | -0.2109 | No |
| 5 | IL10 | NA | 26811 | 0.041 | -0.2541 | No |
| 6 | PTGES | NA | 33974 | 0.001 | -0.3852 | No |
| 7 | IL4 | NA | 45895 | -0.090 | -0.5827 | Yes |
| 8 | LTA | NA | 47064 | -0.109 | -0.5787 | Yes |
| 9 | CCL5 | NA | 48995 | -0.145 | -0.5803 | Yes |
| 10 | TNF | NA | 49309 | -0.151 | -0.5507 | Yes |
| 11 | VNN1 | NA | 50039 | -0.167 | -0.5249 | Yes |
| 12 | THBS1 | NA | 50228 | -0.171 | -0.4883 | Yes |
| 13 | CCL11 | NA | 52457 | -0.227 | -0.4760 | Yes |
| 14 | IDO1 | NA | 52785 | -0.237 | -0.4265 | Yes |
| 15 | S100A9 | NA | 53584 | -0.282 | -0.3753 | Yes |
| 16 | S100A8 | NA | 53840 | -0.305 | -0.3086 | Yes |
| 17 | VCAM1 | NA | 54378 | -0.423 | -0.2196 | Yes |
| 18 | GJA1 | NA | 54438 | -0.455 | -0.1143 | Yes |
| 19 | TNFAIP3 | NA | 54500 | -0.501 | 0.0017 | Yes |