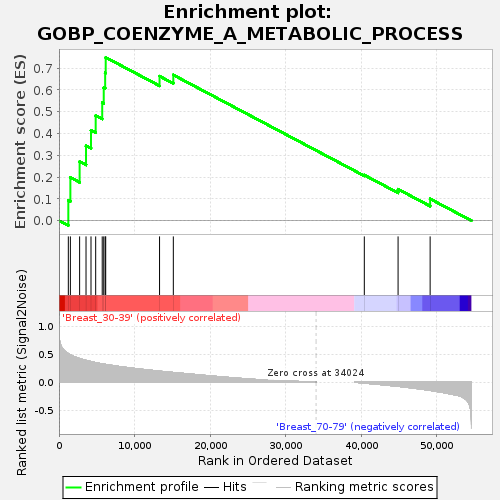
Profile of the Running ES Score & Positions of GeneSet Members on the Rank Ordered List
| Dataset | Breast.Breast.cls #Breast_30-39_versus_Breast_70-79.Breast.cls #Breast_30-39_versus_Breast_70-79_repos |
| Phenotype | Breast.cls#Breast_30-39_versus_Breast_70-79_repos |
| Upregulated in class | Breast_30-39 |
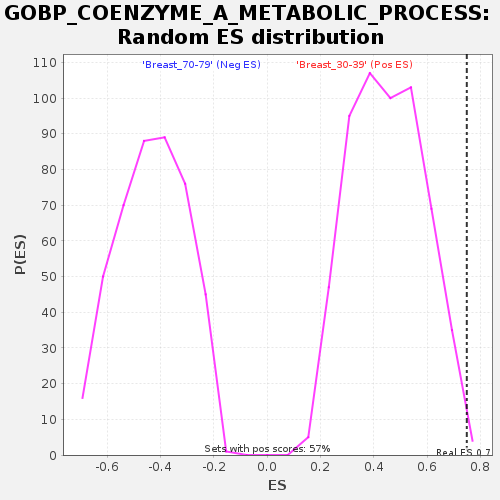
| GeneSet | GOBP_COENZYME_A_METABOLIC_PROCESS |
| Enrichment Score (ES) | 0.7492574 |
| Normalized Enrichment Score (NES) | 1.6694459 |
| Nominal p-value | 0.0053097345 |
| FDR q-value | 0.2530876 |
| FWER p-Value | 0.754 |
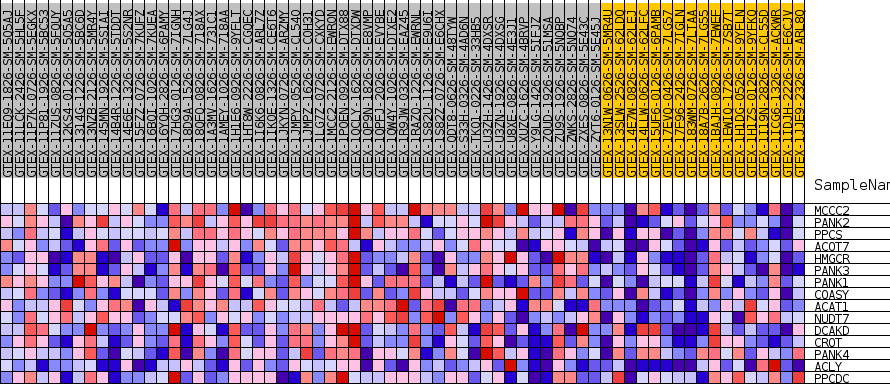
| SYMBOL | TITLE | RANK IN GENE LIST | RANK METRIC SCORE | RUNNING ES | CORE ENRICHMENT | |
|---|---|---|---|---|---|---|
| 1 | MCCC2 | NA | 1234 | 0.509 | 0.0927 | Yes |
| 2 | PANK2 | NA | 1505 | 0.488 | 0.1984 | Yes |
| 3 | PPCS | NA | 2730 | 0.421 | 0.2712 | Yes |
| 4 | ACOT7 | NA | 3577 | 0.389 | 0.3438 | Yes |
| 5 | HMGCR | NA | 4236 | 0.367 | 0.4149 | Yes |
| 6 | PANK3 | NA | 4856 | 0.349 | 0.4826 | Yes |
| 7 | PANK1 | NA | 5721 | 0.327 | 0.5408 | Yes |
| 8 | COASY | NA | 5922 | 0.322 | 0.6102 | Yes |
| 9 | ACAT1 | NA | 6111 | 0.318 | 0.6788 | Yes |
| 10 | NUDT7 | NA | 6183 | 0.317 | 0.7493 | Yes |
| 11 | DCAKD | NA | 13311 | 0.196 | 0.6631 | No |
| 12 | CROT | NA | 15134 | 0.172 | 0.6688 | No |
| 13 | PANK4 | NA | 40417 | -0.017 | 0.2093 | No |
| 14 | ACLY | NA | 44887 | -0.075 | 0.1444 | No |
| 15 | PPCDC | NA | 49131 | -0.147 | 0.1000 | No |