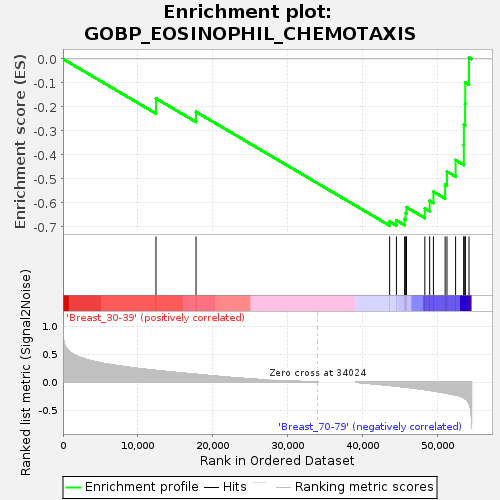
Profile of the Running ES Score & Positions of GeneSet Members on the Rank Ordered List
| Dataset | Breast.Breast.cls #Breast_30-39_versus_Breast_70-79.Breast.cls #Breast_30-39_versus_Breast_70-79_repos |
| Phenotype | Breast.cls#Breast_30-39_versus_Breast_70-79_repos |
| Upregulated in class | Breast_70-79 |
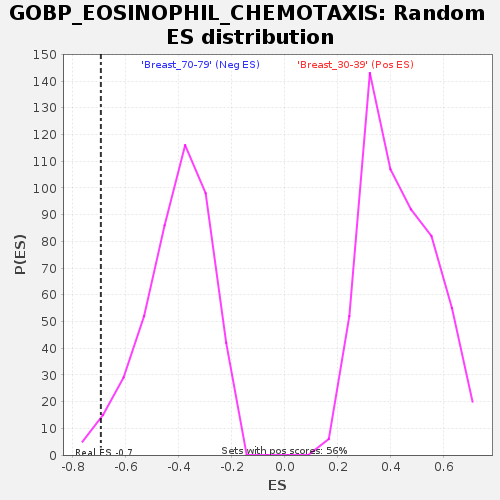
| GeneSet | GOBP_EOSINOPHIL_CHEMOTAXIS |
| Enrichment Score (ES) | -0.6943371 |
| Normalized Enrichment Score (NES) | -1.7032818 |
| Nominal p-value | 0.020316027 |
| FDR q-value | 0.8010397 |
| FWER p-Value | 0.674 |
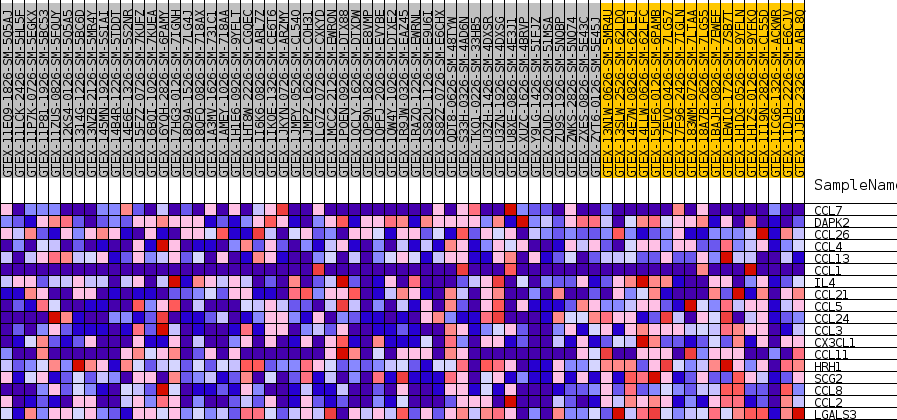
| SYMBOL | TITLE | RANK IN GENE LIST | RANK METRIC SCORE | RUNNING ES | CORE ENRICHMENT | |
|---|---|---|---|---|---|---|
| 1 | CCL7 | NA | 12422 | 0.209 | -0.1644 | No |
| 2 | DAPK2 | NA | 17775 | 0.139 | -0.2203 | No |
| 3 | CCL26 | NA | 43644 | -0.057 | -0.6772 | Yes |
| 4 | CCL4 | NA | 44550 | -0.070 | -0.6726 | Yes |
| 5 | CCL13 | NA | 45642 | -0.086 | -0.6667 | Yes |
| 6 | CCL1 | NA | 45784 | -0.088 | -0.6427 | Yes |
| 7 | IL4 | NA | 45895 | -0.090 | -0.6176 | Yes |
| 8 | CCL21 | NA | 48347 | -0.132 | -0.6227 | Yes |
| 9 | CCL5 | NA | 48995 | -0.145 | -0.5909 | Yes |
| 10 | CCL24 | NA | 49494 | -0.155 | -0.5531 | Yes |
| 11 | CCL3 | NA | 51058 | -0.191 | -0.5241 | Yes |
| 12 | CX3CL1 | NA | 51304 | -0.197 | -0.4691 | Yes |
| 13 | CCL11 | NA | 52457 | -0.227 | -0.4215 | Yes |
| 14 | HRH1 | NA | 53556 | -0.279 | -0.3573 | Yes |
| 15 | SCG2 | NA | 53565 | -0.279 | -0.2730 | Yes |
| 16 | CCL8 | NA | 53728 | -0.293 | -0.1872 | Yes |
| 17 | CCL2 | NA | 53749 | -0.296 | -0.0981 | Yes |
| 18 | LGALS3 | NA | 54248 | -0.375 | 0.0063 | Yes |