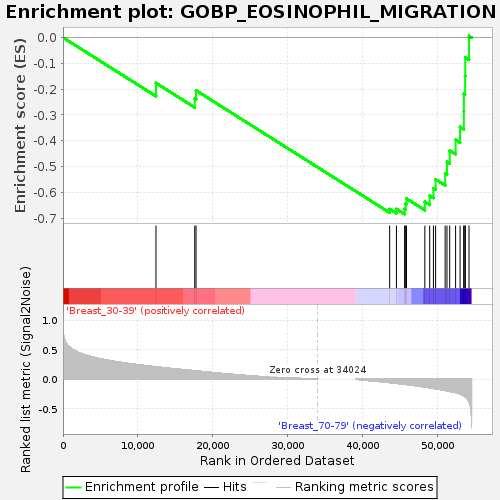
Profile of the Running ES Score & Positions of GeneSet Members on the Rank Ordered List
| Dataset | Breast.Breast.cls #Breast_30-39_versus_Breast_70-79.Breast.cls #Breast_30-39_versus_Breast_70-79_repos |
| Phenotype | Breast.cls#Breast_30-39_versus_Breast_70-79_repos |
| Upregulated in class | Breast_70-79 |
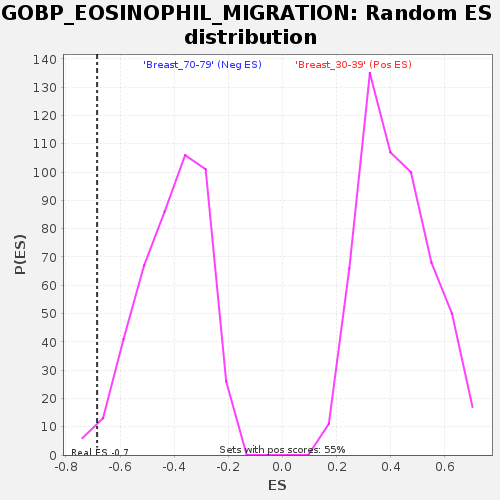
| GeneSet | GOBP_EOSINOPHIL_MIGRATION |
| Enrichment Score (ES) | -0.68453676 |
| Normalized Enrichment Score (NES) | -1.6881974 |
| Nominal p-value | 0.015695067 |
| FDR q-value | 0.63638943 |
| FWER p-Value | 0.712 |
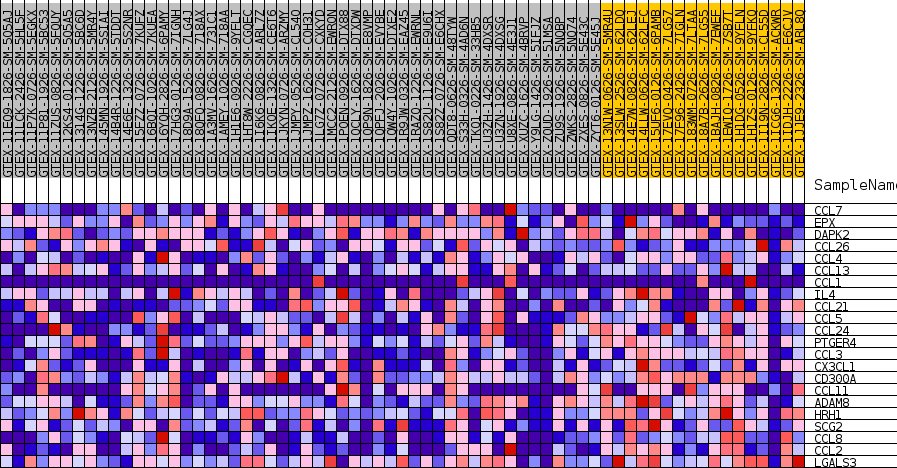
| SYMBOL | TITLE | RANK IN GENE LIST | RANK METRIC SCORE | RUNNING ES | CORE ENRICHMENT | |
|---|---|---|---|---|---|---|
| 1 | CCL7 | NA | 12422 | 0.209 | -0.1762 | No |
| 2 | EPX | NA | 17602 | 0.142 | -0.2363 | No |
| 3 | DAPK2 | NA | 17775 | 0.139 | -0.2051 | No |
| 4 | CCL26 | NA | 43644 | -0.057 | -0.6652 | Yes |
| 5 | CCL4 | NA | 44550 | -0.070 | -0.6645 | Yes |
| 6 | CCL13 | NA | 45642 | -0.086 | -0.6635 | Yes |
| 7 | CCL1 | NA | 45784 | -0.088 | -0.6445 | Yes |
| 8 | IL4 | NA | 45895 | -0.090 | -0.6244 | Yes |
| 9 | CCL21 | NA | 48347 | -0.132 | -0.6369 | Yes |
| 10 | CCL5 | NA | 48995 | -0.145 | -0.6133 | Yes |
| 11 | CCL24 | NA | 49494 | -0.155 | -0.5842 | Yes |
| 12 | PTGER4 | NA | 49785 | -0.162 | -0.5498 | Yes |
| 13 | CCL3 | NA | 51058 | -0.191 | -0.5263 | Yes |
| 14 | CX3CL1 | NA | 51304 | -0.197 | -0.4823 | Yes |
| 15 | CD300A | NA | 51669 | -0.207 | -0.4381 | Yes |
| 16 | CCL11 | NA | 52457 | -0.227 | -0.3966 | Yes |
| 17 | ADAM8 | NA | 53053 | -0.248 | -0.3465 | Yes |
| 18 | HRH1 | NA | 53556 | -0.279 | -0.2871 | Yes |
| 19 | SCG2 | NA | 53565 | -0.279 | -0.2186 | Yes |
| 20 | CCL8 | NA | 53728 | -0.293 | -0.1494 | Yes |
| 21 | CCL2 | NA | 53749 | -0.296 | -0.0769 | Yes |
| 22 | LGALS3 | NA | 54248 | -0.375 | 0.0063 | Yes |