Profile of the Running ES Score & Positions of GeneSet Members on the Rank Ordered List
| Dataset | Breast.Breast.cls #Breast_30-39_versus_Breast_70-79.Breast.cls #Breast_30-39_versus_Breast_70-79_repos |
| Phenotype | Breast.cls#Breast_30-39_versus_Breast_70-79_repos |
| Upregulated in class | Breast_70-79 |
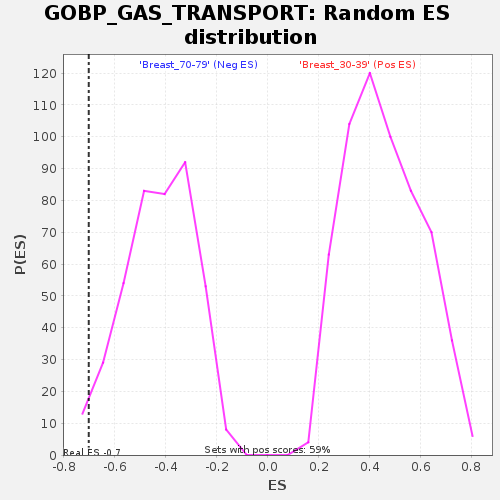
| GeneSet | GOBP_GAS_TRANSPORT |
| Enrichment Score (ES) | -0.70192677 |
| Normalized Enrichment Score (NES) | -1.6507198 |
| Nominal p-value | 0.02173913 |
| FDR q-value | 0.48245376 |
| FWER p-Value | 0.799 |
| SYMBOL | TITLE | RANK IN GENE LIST | RANK METRIC SCORE | RUNNING ES | CORE ENRICHMENT | |
|---|---|---|---|---|---|---|
| 1 | AQP6 | NA | 2805 | 0.417 | 0.0114 | No |
| 2 | AQP5 | NA | 5636 | 0.329 | 0.0091 | No |
| 3 | MB | NA | 15114 | 0.172 | -0.1386 | No |
| 4 | HBZ | NA | 15937 | 0.162 | -0.1292 | No |
| 5 | CA2 | NA | 16610 | 0.154 | -0.1183 | No |
| 6 | IPCEF1 | NA | 17863 | 0.138 | -0.1204 | No |
| 7 | HBE1 | NA | 48078 | -0.127 | -0.6549 | No |
| 8 | RHAG | NA | 50207 | -0.171 | -0.6682 | No |
| 9 | HBG1 | NA | 52049 | -0.216 | -0.6693 | Yes |
| 10 | NGB | NA | 52137 | -0.218 | -0.6380 | Yes |
| 11 | AQP1 | NA | 53517 | -0.277 | -0.6217 | Yes |
| 12 | MYC | NA | 54143 | -0.351 | -0.5802 | Yes |
| 13 | HBG2 | NA | 54189 | -0.361 | -0.5266 | Yes |
| 14 | CYGB | NA | 54402 | -0.435 | -0.4650 | Yes |
| 15 | HBA2 | NA | 54440 | -0.457 | -0.3969 | Yes |
| 16 | HBD | NA | 54482 | -0.482 | -0.3250 | Yes |
| 17 | HBM | NA | 54507 | -0.506 | -0.2491 | Yes |
| 18 | HBB | NA | 54533 | -0.538 | -0.1685 | Yes |
| 19 | HBA1 | NA | 54541 | -0.543 | -0.0869 | Yes |
| 20 | HBQ1 | NA | 54562 | -0.583 | 0.0005 | Yes |