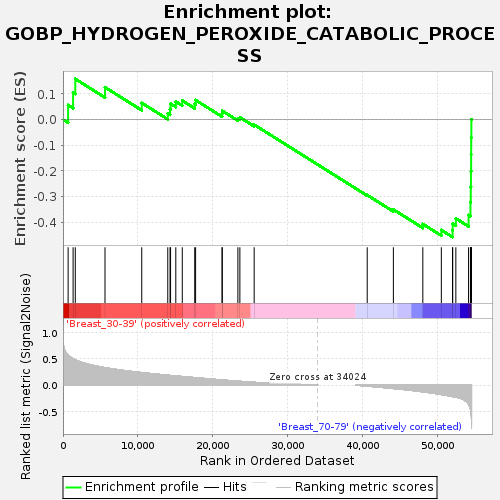
Profile of the Running ES Score & Positions of GeneSet Members on the Rank Ordered List
| Dataset | Breast.Breast.cls #Breast_30-39_versus_Breast_70-79.Breast.cls #Breast_30-39_versus_Breast_70-79_repos |
| Phenotype | Breast.cls#Breast_30-39_versus_Breast_70-79_repos |
| Upregulated in class | Breast_70-79 |
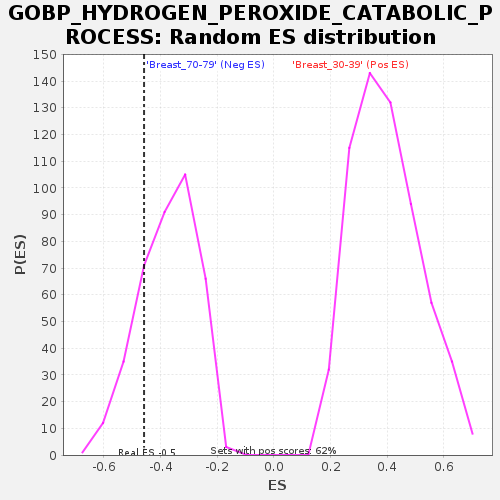
| GeneSet | GOBP_HYDROGEN_PEROXIDE_CATABOLIC_PROCESS |
| Enrichment Score (ES) | -0.4583412 |
| Normalized Enrichment Score (NES) | -1.2289909 |
| Nominal p-value | 0.18489583 |
| FDR q-value | 1.0 |
| FWER p-Value | 0.998 |
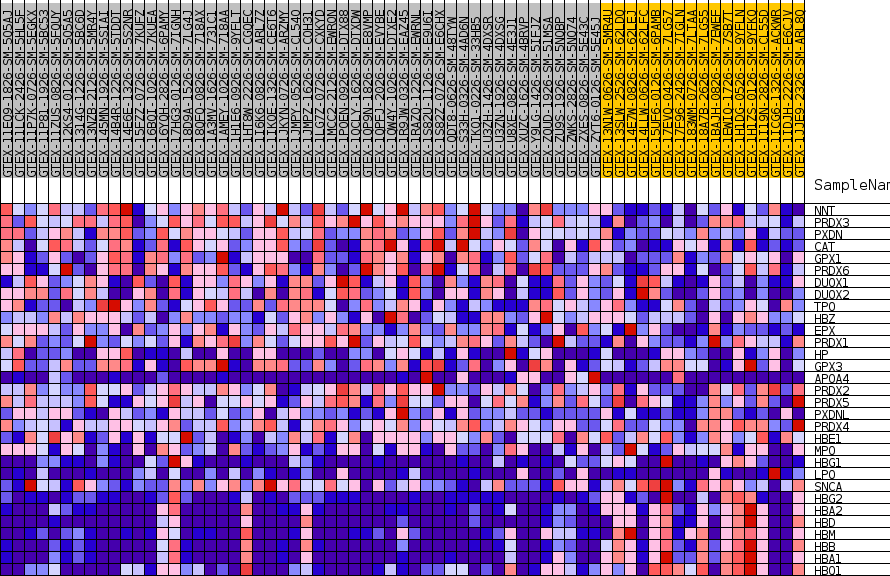
| SYMBOL | TITLE | RANK IN GENE LIST | RANK METRIC SCORE | RUNNING ES | CORE ENRICHMENT | |
|---|---|---|---|---|---|---|
| 1 | NNT | NA | 684 | 0.565 | 0.0565 | No |
| 2 | PRDX3 | NA | 1348 | 0.499 | 0.1053 | No |
| 3 | PXDN | NA | 1641 | 0.479 | 0.1585 | No |
| 4 | CAT | NA | 5611 | 0.330 | 0.1260 | No |
| 5 | GPX1 | NA | 10522 | 0.236 | 0.0649 | No |
| 6 | PRDX6 | NA | 13999 | 0.187 | 0.0240 | No |
| 7 | DUOX1 | NA | 14303 | 0.183 | 0.0407 | No |
| 8 | DUOX2 | NA | 14374 | 0.182 | 0.0616 | No |
| 9 | TPO | NA | 15072 | 0.173 | 0.0700 | No |
| 10 | HBZ | NA | 15937 | 0.162 | 0.0739 | No |
| 11 | EPX | NA | 17602 | 0.142 | 0.0608 | No |
| 12 | PRDX1 | NA | 17716 | 0.140 | 0.0758 | No |
| 13 | HP | NA | 21254 | 0.097 | 0.0228 | No |
| 14 | GPX3 | NA | 21279 | 0.096 | 0.0341 | No |
| 15 | APOA4 | NA | 23367 | 0.073 | 0.0048 | No |
| 16 | PRDX2 | NA | 23632 | 0.071 | 0.0086 | No |
| 17 | PRDX5 | NA | 25543 | 0.052 | -0.0200 | No |
| 18 | PXDNL | NA | 40646 | -0.020 | -0.2944 | No |
| 19 | PRDX4 | NA | 44143 | -0.064 | -0.3507 | No |
| 20 | HBE1 | NA | 48078 | -0.127 | -0.4073 | No |
| 21 | MPO | NA | 50550 | -0.178 | -0.4309 | No |
| 22 | HBG1 | NA | 52049 | -0.216 | -0.4319 | Yes |
| 23 | LPO | NA | 52070 | -0.217 | -0.4058 | Yes |
| 24 | SNCA | NA | 52490 | -0.228 | -0.3856 | Yes |
| 25 | HBG2 | NA | 54189 | -0.361 | -0.3726 | Yes |
| 26 | HBA2 | NA | 54440 | -0.457 | -0.3214 | Yes |
| 27 | HBD | NA | 54482 | -0.482 | -0.2632 | Yes |
| 28 | HBM | NA | 54507 | -0.506 | -0.2018 | Yes |
| 29 | HBB | NA | 54533 | -0.538 | -0.1365 | Yes |
| 30 | HBA1 | NA | 54541 | -0.543 | -0.0703 | Yes |
| 31 | HBQ1 | NA | 54562 | -0.583 | 0.0005 | Yes |