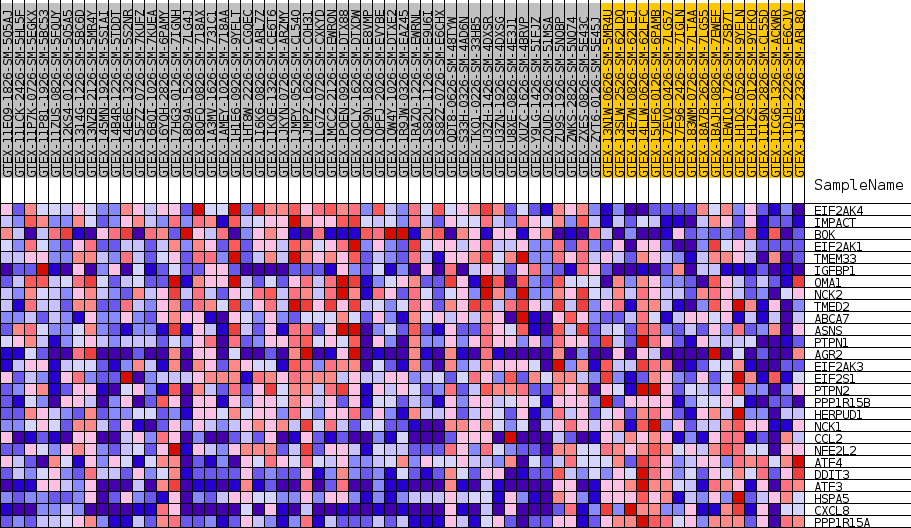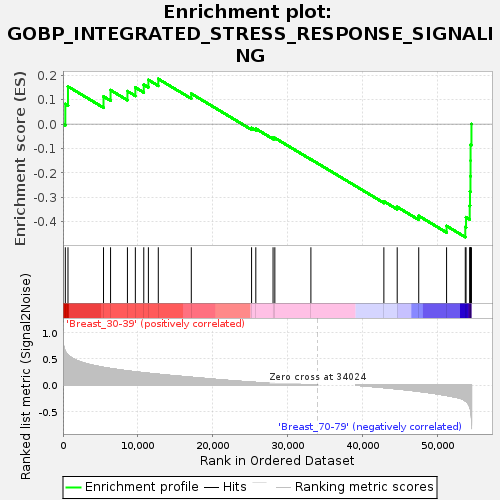
Profile of the Running ES Score & Positions of GeneSet Members on the Rank Ordered List
| Dataset | Breast.Breast.cls #Breast_30-39_versus_Breast_70-79.Breast.cls #Breast_30-39_versus_Breast_70-79_repos |
| Phenotype | Breast.cls#Breast_30-39_versus_Breast_70-79_repos |
| Upregulated in class | Breast_70-79 |
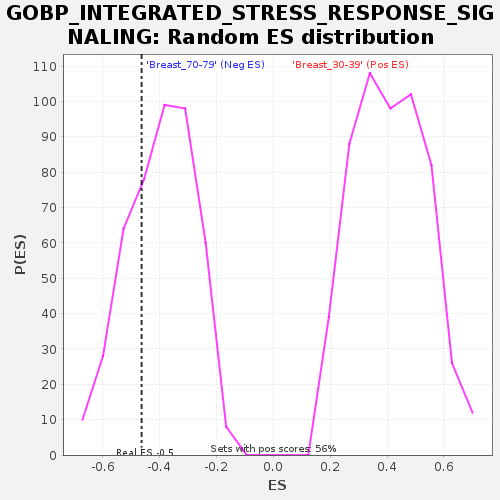
| GeneSet | GOBP_INTEGRATED_STRESS_RESPONSE_SIGNALING |
| Enrichment Score (ES) | -0.46257347 |
| Normalized Enrichment Score (NES) | -1.1660872 |
| Nominal p-value | 0.31235954 |
| FDR q-value | 1.0 |
| FWER p-Value | 0.999 |
| SYMBOL | TITLE | RANK IN GENE LIST | RANK METRIC SCORE | RUNNING ES | CORE ENRICHMENT | |
|---|---|---|---|---|---|---|
| 1 | EIF2AK4 | NA | 310 | 0.635 | 0.0821 | No |
| 2 | IMPACT | NA | 665 | 0.567 | 0.1540 | No |
| 3 | BOK | NA | 5413 | 0.334 | 0.1131 | No |
| 4 | EIF2AK1 | NA | 6355 | 0.313 | 0.1391 | No |
| 5 | TMEM33 | NA | 8608 | 0.268 | 0.1349 | No |
| 6 | IGFBP1 | NA | 9667 | 0.250 | 0.1500 | No |
| 7 | OMA1 | NA | 10792 | 0.232 | 0.1614 | No |
| 8 | NCK2 | NA | 11409 | 0.223 | 0.1810 | No |
| 9 | TMED2 | NA | 12732 | 0.205 | 0.1850 | No |
| 10 | ABCA7 | NA | 17142 | 0.147 | 0.1246 | No |
| 11 | ASNS | NA | 25196 | 0.055 | -0.0153 | No |
| 12 | PTPN1 | NA | 25762 | 0.050 | -0.0188 | No |
| 13 | AGR2 | NA | 28066 | 0.032 | -0.0566 | No |
| 14 | EIF2AK3 | NA | 28305 | 0.031 | -0.0567 | No |
| 15 | EIF2S1 | NA | 33122 | 0.006 | -0.1441 | No |
| 16 | PTPN2 | NA | 42872 | -0.047 | -0.3163 | No |
| 17 | PPP1R15B | NA | 44654 | -0.071 | -0.3391 | No |
| 18 | HERPUD1 | NA | 47531 | -0.117 | -0.3757 | No |
| 19 | NCK1 | NA | 51252 | -0.196 | -0.4168 | No |
| 20 | CCL2 | NA | 53749 | -0.296 | -0.4217 | Yes |
| 21 | NFE2L2 | NA | 53852 | -0.306 | -0.3812 | Yes |
| 22 | ATF4 | NA | 54341 | -0.408 | -0.3338 | Yes |
| 23 | DDIT3 | NA | 54383 | -0.425 | -0.2758 | Yes |
| 24 | ATF3 | NA | 54441 | -0.457 | -0.2137 | Yes |
| 25 | HSPA5 | NA | 54454 | -0.467 | -0.1494 | Yes |
| 26 | CXCL8 | NA | 54458 | -0.470 | -0.0845 | Yes |
| 27 | PPP1R15A | NA | 54575 | -0.629 | 0.0003 | Yes |