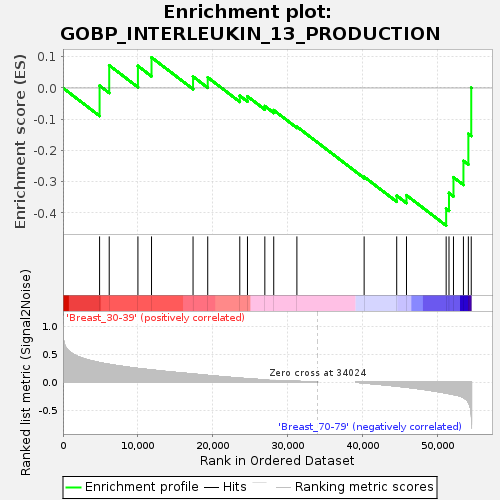
Profile of the Running ES Score & Positions of GeneSet Members on the Rank Ordered List
| Dataset | Breast.Breast.cls #Breast_30-39_versus_Breast_70-79.Breast.cls #Breast_30-39_versus_Breast_70-79_repos |
| Phenotype | Breast.cls#Breast_30-39_versus_Breast_70-79_repos |
| Upregulated in class | Breast_70-79 |
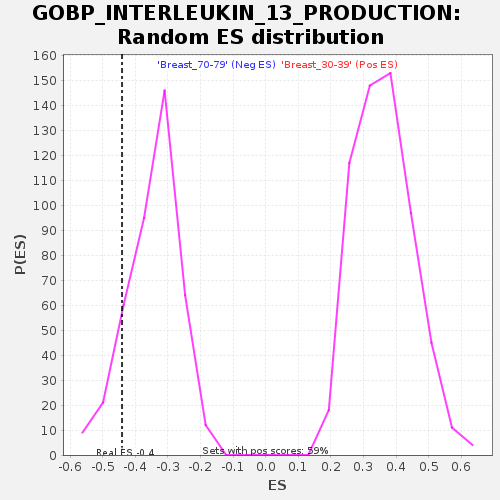
| GeneSet | GOBP_INTERLEUKIN_13_PRODUCTION |
| Enrichment Score (ES) | -0.4404176 |
| Normalized Enrichment Score (NES) | -1.276131 |
| Nominal p-value | 0.11793612 |
| FDR q-value | 1.0 |
| FWER p-Value | 0.998 |
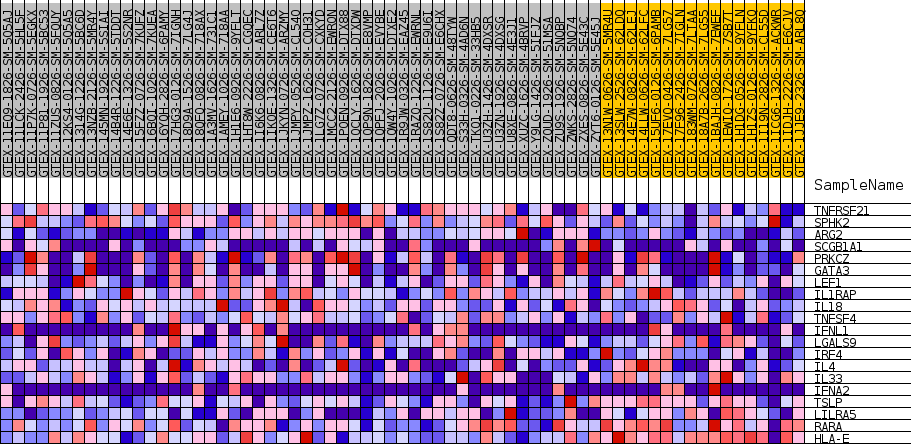
| SYMBOL | TITLE | RANK IN GENE LIST | RANK METRIC SCORE | RUNNING ES | CORE ENRICHMENT | |
|---|---|---|---|---|---|---|
| 1 | TNFRSF21 | NA | 4888 | 0.348 | 0.0077 | No |
| 2 | SPHK2 | NA | 6175 | 0.317 | 0.0726 | No |
| 3 | ARG2 | NA | 10010 | 0.244 | 0.0706 | No |
| 4 | SCGB1A1 | NA | 11828 | 0.217 | 0.0978 | No |
| 5 | PRKCZ | NA | 17376 | 0.145 | 0.0365 | No |
| 6 | GATA3 | NA | 19337 | 0.120 | 0.0340 | No |
| 7 | LEF1 | NA | 23620 | 0.071 | -0.0247 | No |
| 8 | IL1RAP | NA | 24648 | 0.060 | -0.0267 | No |
| 9 | IL18 | NA | 26968 | 0.040 | -0.0581 | No |
| 10 | TNFSF4 | NA | 28156 | 0.032 | -0.0710 | No |
| 11 | IFNL1 | NA | 31251 | 0.014 | -0.1238 | No |
| 12 | LGALS9 | NA | 40236 | -0.015 | -0.2844 | No |
| 13 | IRF4 | NA | 44587 | -0.070 | -0.3444 | No |
| 14 | IL4 | NA | 45895 | -0.090 | -0.3433 | No |
| 15 | IL33 | NA | 51195 | -0.194 | -0.3862 | Yes |
| 16 | IFNA2 | NA | 51574 | -0.204 | -0.3361 | Yes |
| 17 | TSLP | NA | 52173 | -0.220 | -0.2858 | Yes |
| 18 | LILRA5 | NA | 53504 | -0.275 | -0.2332 | Yes |
| 19 | RARA | NA | 54161 | -0.354 | -0.1465 | Yes |
| 20 | HLA-E | NA | 54547 | -0.553 | 0.0008 | Yes |