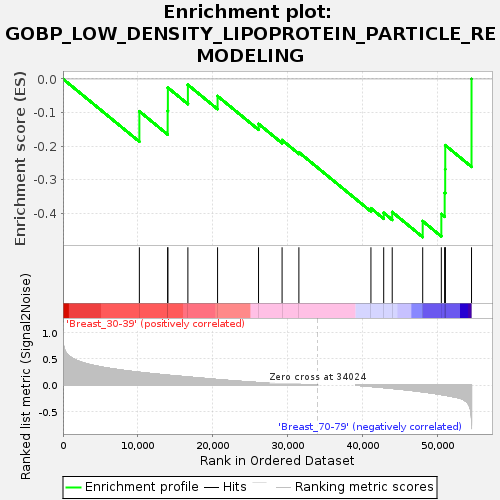
Profile of the Running ES Score & Positions of GeneSet Members on the Rank Ordered List
| Dataset | Breast.Breast.cls #Breast_30-39_versus_Breast_70-79.Breast.cls #Breast_30-39_versus_Breast_70-79_repos |
| Phenotype | Breast.cls#Breast_30-39_versus_Breast_70-79_repos |
| Upregulated in class | Breast_70-79 |
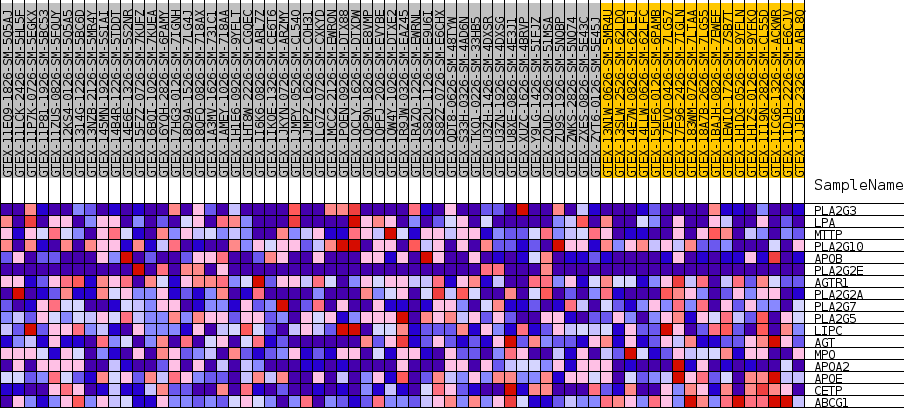
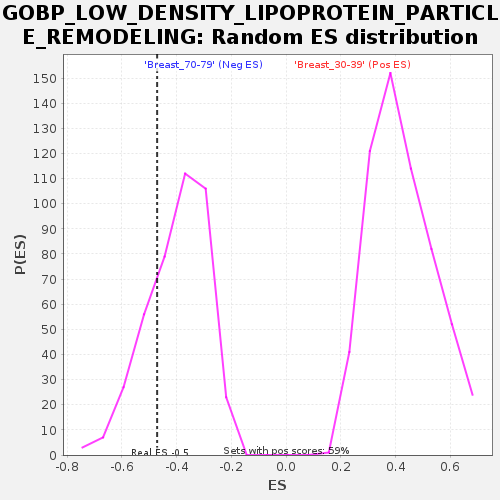
| GeneSet | GOBP_LOW_DENSITY_LIPOPROTEIN_PARTICLE_REMODELING |
| Enrichment Score (ES) | -0.47128025 |
| Normalized Enrichment Score (NES) | -1.1768477 |
| Nominal p-value | 0.2639225 |
| FDR q-value | 1.0 |
| FWER p-Value | 0.999 |
| SYMBOL | TITLE | RANK IN GENE LIST | RANK METRIC SCORE | RUNNING ES | CORE ENRICHMENT | |
|---|---|---|---|---|---|---|
| 1 | PLA2G3 | NA | 10203 | 0.241 | -0.0963 | No |
| 2 | LPA | NA | 13984 | 0.187 | -0.0954 | No |
| 3 | MTTP | NA | 14012 | 0.186 | -0.0259 | No |
| 4 | PLA2G10 | NA | 16686 | 0.153 | -0.0174 | No |
| 5 | APOB | NA | 20653 | 0.104 | -0.0511 | No |
| 6 | PLA2G2E | NA | 26126 | 0.047 | -0.1338 | No |
| 7 | AGTR1 | NA | 29272 | 0.024 | -0.1823 | No |
| 8 | PLA2G2A | NA | 31517 | 0.013 | -0.2186 | No |
| 9 | PLA2G7 | NA | 41144 | -0.025 | -0.3854 | No |
| 10 | PLA2G5 | NA | 42850 | -0.047 | -0.3991 | No |
| 11 | LIPC | NA | 43988 | -0.062 | -0.3967 | No |
| 12 | AGT | NA | 48061 | -0.127 | -0.4237 | Yes |
| 13 | MPO | NA | 50550 | -0.178 | -0.4025 | Yes |
| 14 | APOA2 | NA | 50997 | -0.189 | -0.3396 | Yes |
| 15 | APOE | NA | 51066 | -0.191 | -0.2692 | Yes |
| 16 | CETP | NA | 51074 | -0.191 | -0.1975 | Yes |
| 17 | ABCG1 | NA | 54585 | -0.697 | 0.0001 | Yes |