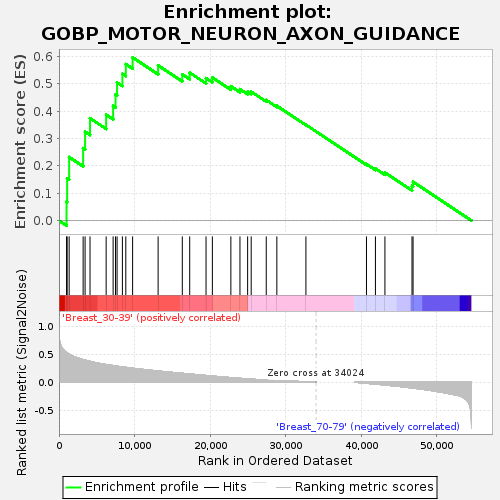
Profile of the Running ES Score & Positions of GeneSet Members on the Rank Ordered List
| Dataset | Breast.Breast.cls #Breast_30-39_versus_Breast_70-79.Breast.cls #Breast_30-39_versus_Breast_70-79_repos |
| Phenotype | Breast.cls#Breast_30-39_versus_Breast_70-79_repos |
| Upregulated in class | Breast_30-39 |
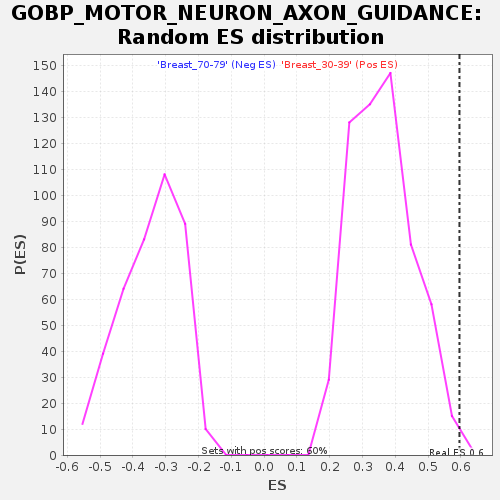
| GeneSet | GOBP_MOTOR_NEURON_AXON_GUIDANCE |
| Enrichment Score (ES) | 0.5956326 |
| Normalized Enrichment Score (NES) | 1.6478399 |
| Nominal p-value | 0.006722689 |
| FDR q-value | 0.24510872 |
| FWER p-Value | 0.81 |
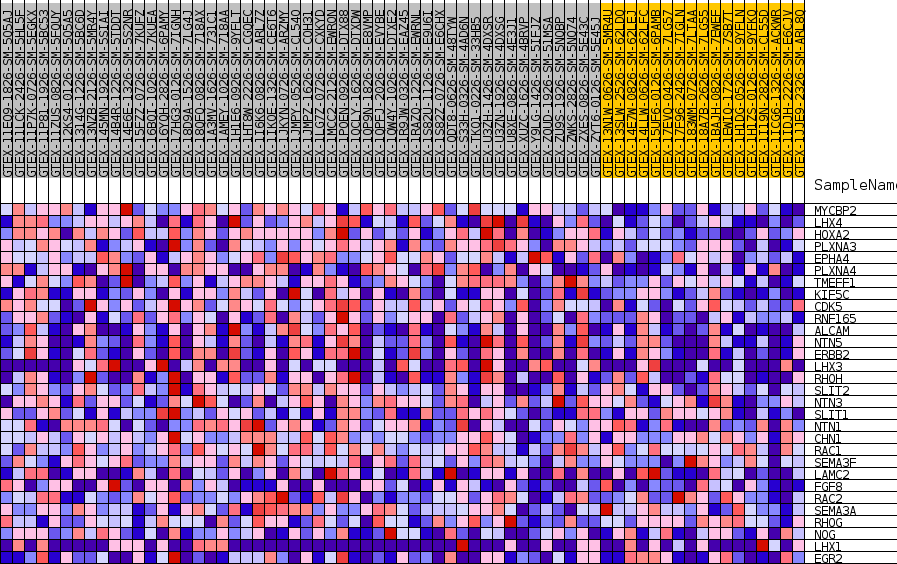
| SYMBOL | TITLE | RANK IN GENE LIST | RANK METRIC SCORE | RUNNING ES | CORE ENRICHMENT | |
|---|---|---|---|---|---|---|
| 1 | MYCBP2 | NA | 998 | 0.531 | 0.0693 | Yes |
| 2 | LHX4 | NA | 1078 | 0.523 | 0.1542 | Yes |
| 3 | HOXA2 | NA | 1345 | 0.499 | 0.2318 | Yes |
| 4 | PLXNA3 | NA | 3194 | 0.402 | 0.2643 | Yes |
| 5 | EPHA4 | NA | 3452 | 0.393 | 0.3244 | Yes |
| 6 | PLXNA4 | NA | 4106 | 0.371 | 0.3737 | Yes |
| 7 | TMEFF1 | NA | 6242 | 0.315 | 0.3866 | Yes |
| 8 | KIF5C | NA | 7164 | 0.296 | 0.4185 | Yes |
| 9 | CDK5 | NA | 7483 | 0.289 | 0.4605 | Yes |
| 10 | RNF165 | NA | 7688 | 0.285 | 0.5038 | Yes |
| 11 | ALCAM | NA | 8392 | 0.272 | 0.5358 | Yes |
| 12 | NTN5 | NA | 8844 | 0.264 | 0.5711 | Yes |
| 13 | ERBB2 | NA | 9744 | 0.248 | 0.5956 | Yes |
| 14 | LHX3 | NA | 13121 | 0.199 | 0.5666 | No |
| 15 | RHOH | NA | 16322 | 0.157 | 0.5339 | No |
| 16 | SLIT2 | NA | 17302 | 0.145 | 0.5400 | No |
| 17 | NTN3 | NA | 19464 | 0.118 | 0.5199 | No |
| 18 | SLIT1 | NA | 20302 | 0.108 | 0.5223 | No |
| 19 | NTN1 | NA | 22751 | 0.080 | 0.4906 | No |
| 20 | CHN1 | NA | 23955 | 0.067 | 0.4796 | No |
| 21 | RAC1 | NA | 24971 | 0.058 | 0.4705 | No |
| 22 | SEMA3F | NA | 25442 | 0.053 | 0.4707 | No |
| 23 | LAMC2 | NA | 27436 | 0.036 | 0.4401 | No |
| 24 | FGF8 | NA | 28838 | 0.027 | 0.4189 | No |
| 25 | RAC2 | NA | 32687 | 0.008 | 0.3498 | No |
| 26 | SEMA3A | NA | 40702 | -0.020 | 0.2062 | No |
| 27 | RHOG | NA | 41889 | -0.034 | 0.1901 | No |
| 28 | NOG | NA | 43145 | -0.050 | 0.1754 | No |
| 29 | LHX1 | NA | 46730 | -0.103 | 0.1267 | No |
| 30 | EGR2 | NA | 46870 | -0.105 | 0.1415 | No |