Profile of the Running ES Score & Positions of GeneSet Members on the Rank Ordered List
| Dataset | Breast.Breast.cls #Breast_30-39_versus_Breast_70-79.Breast.cls #Breast_30-39_versus_Breast_70-79_repos |
| Phenotype | Breast.cls#Breast_30-39_versus_Breast_70-79_repos |
| Upregulated in class | Breast_30-39 |
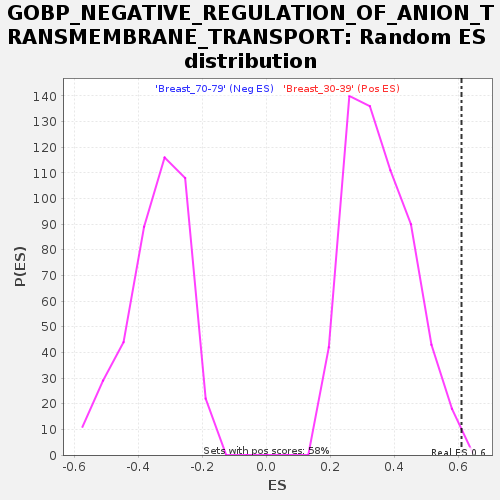
| GeneSet | GOBP_NEGATIVE_REGULATION_OF_ANION_TRANSMEMBRANE_TRANSPORT |
| Enrichment Score (ES) | 0.61078 |
| Normalized Enrichment Score (NES) | 1.7200031 |
| Nominal p-value | 0.0017211704 |
| FDR q-value | 0.40251675 |
| FWER p-Value | 0.588 |
| SYMBOL | TITLE | RANK IN GENE LIST | RANK METRIC SCORE | RUNNING ES | CORE ENRICHMENT | |
|---|---|---|---|---|---|---|
| 1 | APPL2 | NA | 333 | 0.629 | 0.0743 | Yes |
| 2 | MTOR | NA | 355 | 0.623 | 0.1534 | Yes |
| 3 | ARL6IP5 | NA | 554 | 0.585 | 0.2245 | Yes |
| 4 | INPP5K | NA | 1017 | 0.528 | 0.2835 | Yes |
| 5 | GOPC | NA | 1304 | 0.503 | 0.3425 | Yes |
| 6 | AKT2 | NA | 1358 | 0.498 | 0.4051 | Yes |
| 7 | GRB10 | NA | 1373 | 0.497 | 0.4683 | Yes |
| 8 | AKT1 | NA | 1390 | 0.496 | 0.5314 | Yes |
| 9 | LEP | NA | 1684 | 0.477 | 0.5869 | Yes |
| 10 | ENPP1 | NA | 4763 | 0.352 | 0.5754 | Yes |
| 11 | STXBP3 | NA | 6567 | 0.308 | 0.5816 | Yes |
| 12 | IRS2 | NA | 7052 | 0.298 | 0.6108 | Yes |
| 13 | GSK3A | NA | 11015 | 0.229 | 0.5674 | No |
| 14 | TCAF2 | NA | 12444 | 0.209 | 0.5678 | No |
| 15 | OAZ3 | NA | 18233 | 0.134 | 0.4788 | No |
| 16 | ANO9 | NA | 18486 | 0.131 | 0.4909 | No |
| 17 | PEA15 | NA | 22105 | 0.087 | 0.4357 | No |
| 18 | IL1B | NA | 23517 | 0.072 | 0.4190 | No |
| 19 | RGS4 | NA | 24238 | 0.065 | 0.4140 | No |
| 20 | PID1 | NA | 24739 | 0.060 | 0.4125 | No |
| 21 | MIR107 | NA | 28878 | 0.027 | 0.3401 | No |
| 22 | SELENOS | NA | 29430 | 0.024 | 0.3330 | No |
| 23 | OAZ1 | NA | 32935 | 0.007 | 0.2697 | No |
| 24 | MIR103A1 | NA | 35279 | 0.000 | 0.2267 | No |
| 25 | PRKCB | NA | 40625 | -0.019 | 0.1312 | No |
| 26 | OAZ2 | NA | 41968 | -0.035 | 0.1111 | No |
| 27 | SLC43A1 | NA | 42667 | -0.044 | 0.1039 | No |
| 28 | FABP5 | NA | 43523 | -0.055 | 0.0953 | No |
| 29 | SLC43A2 | NA | 47254 | -0.112 | 0.0412 | No |
| 30 | RGS2 | NA | 49146 | -0.148 | 0.0254 | No |
| 31 | TNF | NA | 49309 | -0.151 | 0.0417 | No |
| 32 | THBS1 | NA | 50228 | -0.171 | 0.0468 | No |
| 33 | OSTN | NA | 53286 | -0.260 | 0.0239 | No |