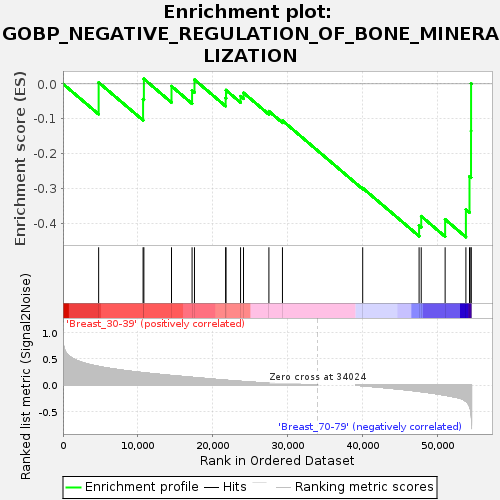
Profile of the Running ES Score & Positions of GeneSet Members on the Rank Ordered List
| Dataset | Breast.Breast.cls #Breast_30-39_versus_Breast_70-79.Breast.cls #Breast_30-39_versus_Breast_70-79_repos |
| Phenotype | Breast.cls#Breast_30-39_versus_Breast_70-79_repos |
| Upregulated in class | Breast_70-79 |
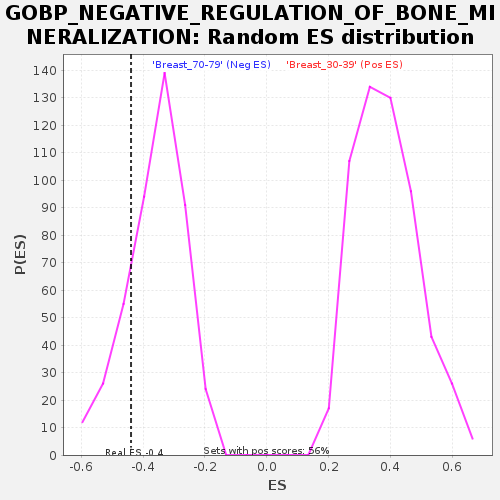
| GeneSet | GOBP_NEGATIVE_REGULATION_OF_BONE_MINERALIZATION |
| Enrichment Score (ES) | -0.43941015 |
| Normalized Enrichment Score (NES) | -1.2188929 |
| Nominal p-value | 0.19501133 |
| FDR q-value | 1.0 |
| FWER p-Value | 0.998 |
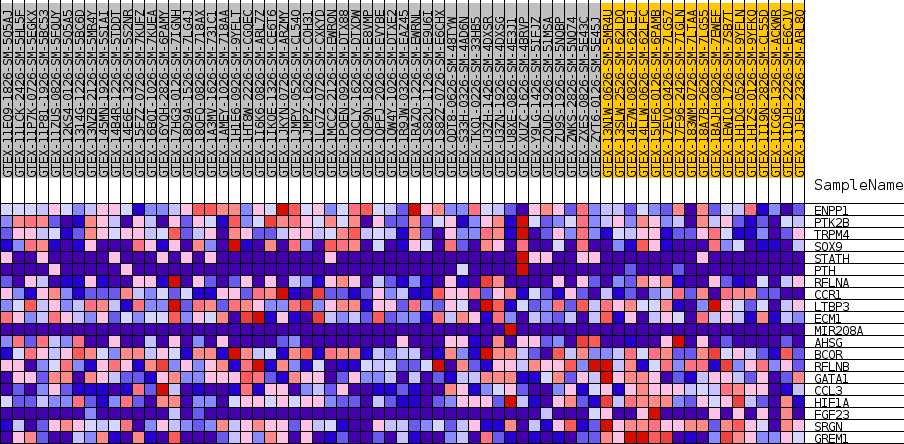
| SYMBOL | TITLE | RANK IN GENE LIST | RANK METRIC SCORE | RUNNING ES | CORE ENRICHMENT | |
|---|---|---|---|---|---|---|
| 1 | ENPP1 | NA | 4763 | 0.352 | 0.0040 | No |
| 2 | PTK2B | NA | 10700 | 0.234 | -0.0441 | No |
| 3 | TRPM4 | NA | 10807 | 0.232 | 0.0142 | No |
| 4 | SOX9 | NA | 14498 | 0.180 | -0.0067 | No |
| 5 | STATH | NA | 17246 | 0.146 | -0.0190 | No |
| 6 | PTH | NA | 17567 | 0.142 | 0.0120 | No |
| 7 | RFLNA | NA | 21730 | 0.091 | -0.0406 | No |
| 8 | CCR1 | NA | 21778 | 0.090 | -0.0180 | No |
| 9 | LTBP3 | NA | 23725 | 0.070 | -0.0355 | No |
| 10 | ECM1 | NA | 24118 | 0.066 | -0.0257 | No |
| 11 | MIR208A | NA | 27512 | 0.036 | -0.0785 | No |
| 12 | AHSG | NA | 29322 | 0.024 | -0.1054 | No |
| 13 | BCOR | NA | 40044 | -0.012 | -0.2987 | No |
| 14 | RFLNB | NA | 47579 | -0.118 | -0.4063 | Yes |
| 15 | GATA1 | NA | 47864 | -0.123 | -0.3795 | Yes |
| 16 | CCL3 | NA | 51058 | -0.191 | -0.3886 | Yes |
| 17 | HIF1A | NA | 53833 | -0.305 | -0.3602 | Yes |
| 18 | FGF23 | NA | 54314 | -0.399 | -0.2655 | Yes |
| 19 | SRGN | NA | 54519 | -0.516 | -0.1351 | Yes |
| 20 | GREM1 | NA | 54526 | -0.525 | 0.0012 | Yes |