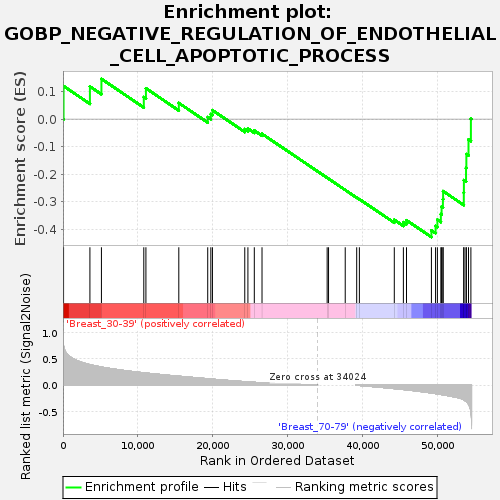
Profile of the Running ES Score & Positions of GeneSet Members on the Rank Ordered List
| Dataset | Breast.Breast.cls #Breast_30-39_versus_Breast_70-79.Breast.cls #Breast_30-39_versus_Breast_70-79_repos |
| Phenotype | Breast.cls#Breast_30-39_versus_Breast_70-79_repos |
| Upregulated in class | Breast_70-79 |
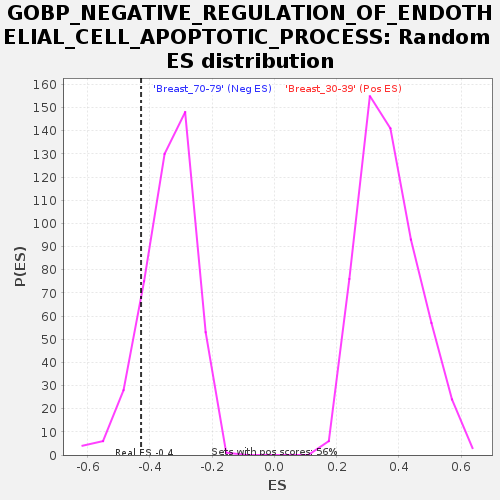
| GeneSet | GOBP_NEGATIVE_REGULATION_OF_ENDOTHELIAL_CELL_APOPTOTIC_PROCESS |
| Enrichment Score (ES) | -0.42804533 |
| Normalized Enrichment Score (NES) | -1.257023 |
| Nominal p-value | 0.13932584 |
| FDR q-value | 1.0 |
| FWER p-Value | 0.998 |
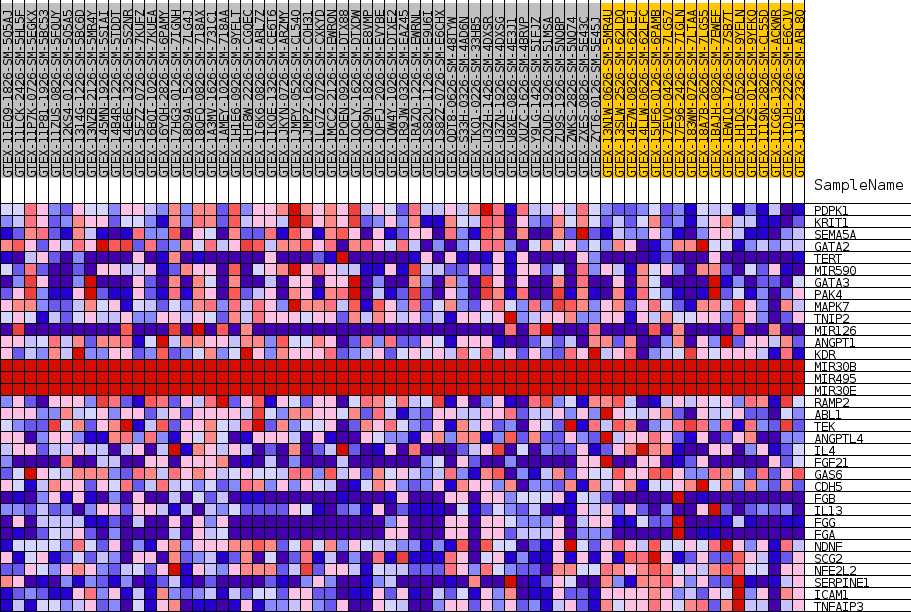
| SYMBOL | TITLE | RANK IN GENE LIST | RANK METRIC SCORE | RUNNING ES | CORE ENRICHMENT | |
|---|---|---|---|---|---|---|
| 1 | PDPK1 | NA | 76 | 0.745 | 0.1197 | No |
| 2 | KRIT1 | NA | 3596 | 0.388 | 0.1183 | No |
| 3 | SEMA5A | NA | 5134 | 0.342 | 0.1458 | No |
| 4 | GATA2 | NA | 10795 | 0.232 | 0.0798 | No |
| 5 | TERT | NA | 11079 | 0.228 | 0.1116 | No |
| 6 | MIR590 | NA | 15473 | 0.168 | 0.0585 | No |
| 7 | GATA3 | NA | 19337 | 0.120 | 0.0071 | No |
| 8 | PAK4 | NA | 19752 | 0.114 | 0.0181 | No |
| 9 | MAPK7 | NA | 19967 | 0.112 | 0.0323 | No |
| 10 | TNIP2 | NA | 24286 | 0.064 | -0.0364 | No |
| 11 | MIR126 | NA | 24707 | 0.060 | -0.0343 | No |
| 12 | ANGPT1 | NA | 25561 | 0.052 | -0.0415 | No |
| 13 | KDR | NA | 26591 | 0.042 | -0.0535 | No |
| 14 | MIR30B | NA | 35294 | 0.000 | -0.2130 | No |
| 15 | MIR495 | NA | 35480 | 0.000 | -0.2164 | No |
| 16 | MIR30E | NA | 37709 | 0.000 | -0.2572 | No |
| 17 | RAMP2 | NA | 39242 | -0.002 | -0.2850 | No |
| 18 | ABL1 | NA | 39600 | -0.006 | -0.2905 | No |
| 19 | TEK | NA | 44265 | -0.066 | -0.3653 | No |
| 20 | ANGPTL4 | NA | 45479 | -0.083 | -0.3740 | No |
| 21 | IL4 | NA | 45895 | -0.090 | -0.3670 | No |
| 22 | FGF21 | NA | 49225 | -0.149 | -0.4038 | Yes |
| 23 | GAS6 | NA | 49780 | -0.161 | -0.3876 | Yes |
| 24 | CDH5 | NA | 50023 | -0.167 | -0.3649 | Yes |
| 25 | FGB | NA | 50488 | -0.176 | -0.3447 | Yes |
| 26 | IL13 | NA | 50585 | -0.179 | -0.3174 | Yes |
| 27 | FGG | NA | 50761 | -0.183 | -0.2908 | Yes |
| 28 | FGA | NA | 50789 | -0.184 | -0.2614 | Yes |
| 29 | NDNF | NA | 53553 | -0.278 | -0.2667 | Yes |
| 30 | SCG2 | NA | 53565 | -0.279 | -0.2215 | Yes |
| 31 | NFE2L2 | NA | 53852 | -0.306 | -0.1769 | Yes |
| 32 | SERPINE1 | NA | 53895 | -0.311 | -0.1271 | Yes |
| 33 | ICAM1 | NA | 54181 | -0.359 | -0.0740 | Yes |
| 34 | TNFAIP3 | NA | 54500 | -0.501 | 0.0017 | Yes |