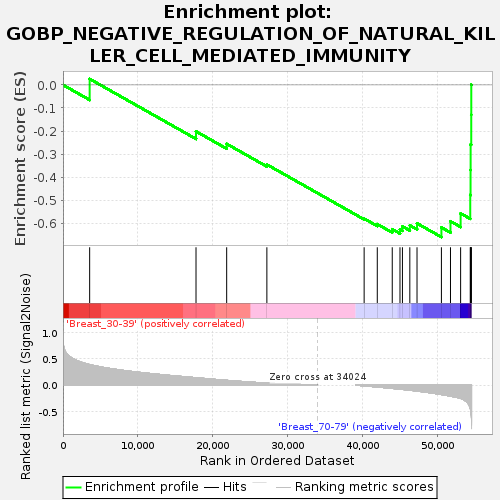
Profile of the Running ES Score & Positions of GeneSet Members on the Rank Ordered List
| Dataset | Breast.Breast.cls #Breast_30-39_versus_Breast_70-79.Breast.cls #Breast_30-39_versus_Breast_70-79_repos |
| Phenotype | Breast.cls#Breast_30-39_versus_Breast_70-79_repos |
| Upregulated in class | Breast_70-79 |
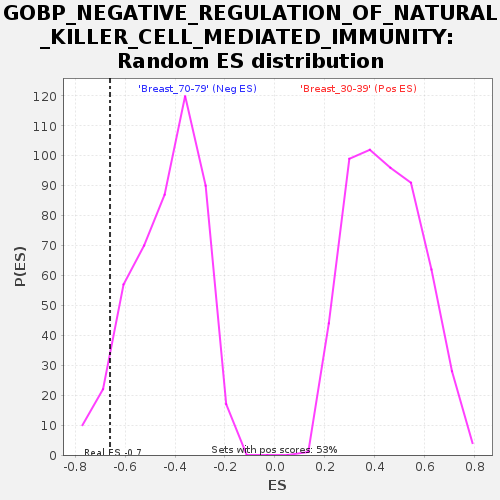
| GeneSet | GOBP_NEGATIVE_REGULATION_OF_NATURAL_KILLER_CELL_MEDIATED_IMMUNITY |
| Enrichment Score (ES) | -0.66003186 |
| Normalized Enrichment Score (NES) | -1.5259879 |
| Nominal p-value | 0.059196617 |
| FDR q-value | 0.6562767 |
| FWER p-Value | 0.942 |
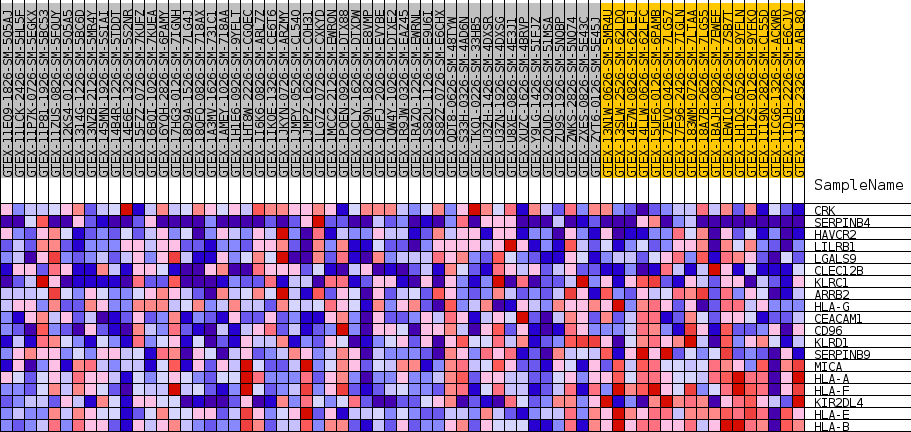
| SYMBOL | TITLE | RANK IN GENE LIST | RANK METRIC SCORE | RUNNING ES | CORE ENRICHMENT | |
|---|---|---|---|---|---|---|
| 1 | CRK | NA | 3562 | 0.389 | 0.0260 | No |
| 2 | SERPINB4 | NA | 17772 | 0.140 | -0.2016 | No |
| 3 | HAVCR2 | NA | 21869 | 0.090 | -0.2557 | No |
| 4 | LILRB1 | NA | 27240 | 0.038 | -0.3452 | No |
| 5 | LGALS9 | NA | 40236 | -0.015 | -0.5800 | No |
| 6 | CLEC12B | NA | 41992 | -0.035 | -0.6038 | No |
| 7 | KLRC1 | NA | 43992 | -0.062 | -0.6260 | No |
| 8 | ARRB2 | NA | 45025 | -0.077 | -0.6268 | Yes |
| 9 | HLA-G | NA | 45353 | -0.081 | -0.6137 | Yes |
| 10 | CEACAM1 | NA | 46340 | -0.097 | -0.6091 | Yes |
| 11 | CD96 | NA | 47302 | -0.112 | -0.6003 | Yes |
| 12 | KLRD1 | NA | 50561 | -0.178 | -0.6183 | Yes |
| 13 | SERPINB9 | NA | 51773 | -0.209 | -0.5914 | Yes |
| 14 | MICA | NA | 53128 | -0.251 | -0.5572 | Yes |
| 15 | HLA-A | NA | 54414 | -0.439 | -0.4777 | Yes |
| 16 | HLA-F | NA | 54455 | -0.467 | -0.3688 | Yes |
| 17 | KIR2DL4 | NA | 54465 | -0.472 | -0.2581 | Yes |
| 18 | HLA-E | NA | 54547 | -0.553 | -0.1299 | Yes |
| 19 | HLA-B | NA | 54552 | -0.557 | 0.0007 | Yes |