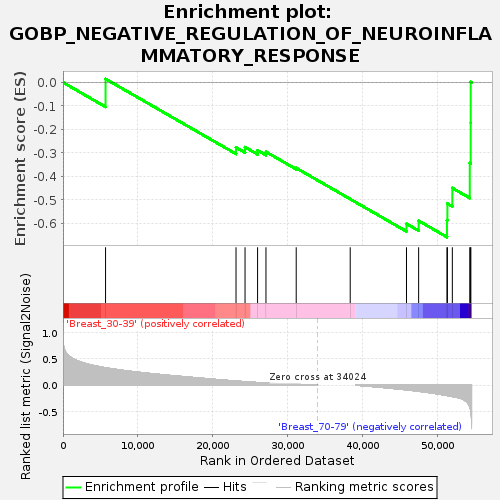
Profile of the Running ES Score & Positions of GeneSet Members on the Rank Ordered List
| Dataset | Breast.Breast.cls #Breast_30-39_versus_Breast_70-79.Breast.cls #Breast_30-39_versus_Breast_70-79_repos |
| Phenotype | Breast.cls#Breast_30-39_versus_Breast_70-79_repos |
| Upregulated in class | Breast_70-79 |
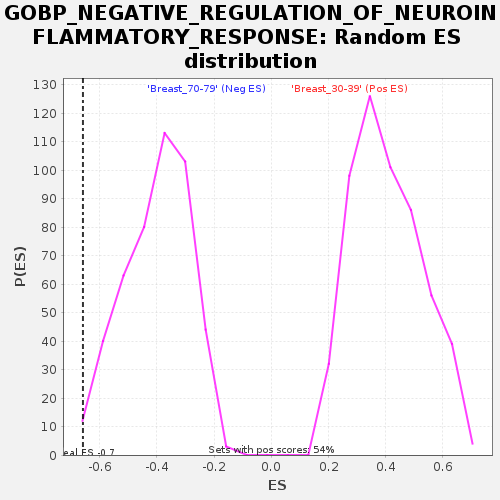
| GeneSet | GOBP_NEGATIVE_REGULATION_OF_NEUROINFLAMMATORY_RESPONSE |
| Enrichment Score (ES) | -0.65854716 |
| Normalized Enrichment Score (NES) | -1.648565 |
| Nominal p-value | 0.013100437 |
| FDR q-value | 0.42468458 |
| FWER p-Value | 0.802 |
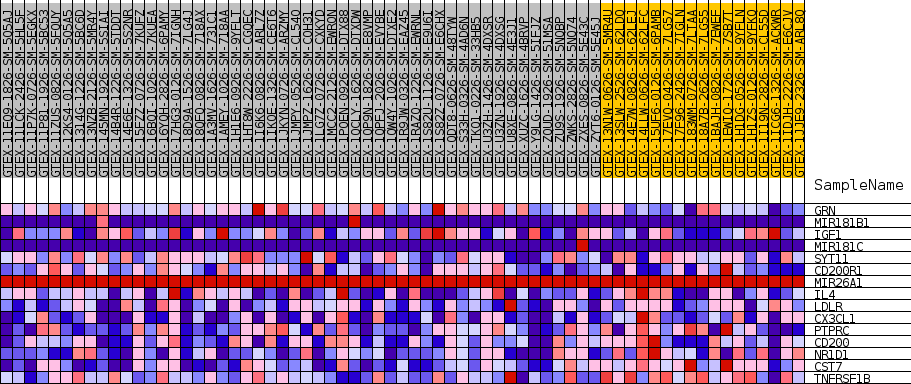
| SYMBOL | TITLE | RANK IN GENE LIST | RANK METRIC SCORE | RUNNING ES | CORE ENRICHMENT | |
|---|---|---|---|---|---|---|
| 1 | GRN | NA | 5685 | 0.328 | 0.0149 | No |
| 2 | MIR181B1 | NA | 23118 | 0.076 | -0.2769 | No |
| 3 | IGF1 | NA | 24322 | 0.064 | -0.2757 | No |
| 4 | MIR181C | NA | 25998 | 0.048 | -0.2891 | No |
| 5 | SYT11 | NA | 27119 | 0.038 | -0.2957 | No |
| 6 | CD200R1 | NA | 31160 | 0.015 | -0.3644 | No |
| 7 | MIR26A1 | NA | 38376 | 0.000 | -0.4966 | No |
| 8 | IL4 | NA | 45895 | -0.090 | -0.6018 | Yes |
| 9 | LDLR | NA | 47518 | -0.117 | -0.5892 | Yes |
| 10 | CX3CL1 | NA | 51304 | -0.197 | -0.5870 | Yes |
| 11 | PTPRC | NA | 51361 | -0.198 | -0.5160 | Yes |
| 12 | CD200 | NA | 52020 | -0.216 | -0.4497 | Yes |
| 13 | NR1D1 | NA | 54350 | -0.410 | -0.3433 | Yes |
| 14 | CST7 | NA | 54473 | -0.478 | -0.1719 | Yes |
| 15 | TNFRSF1B | NA | 54476 | -0.479 | 0.0021 | Yes |