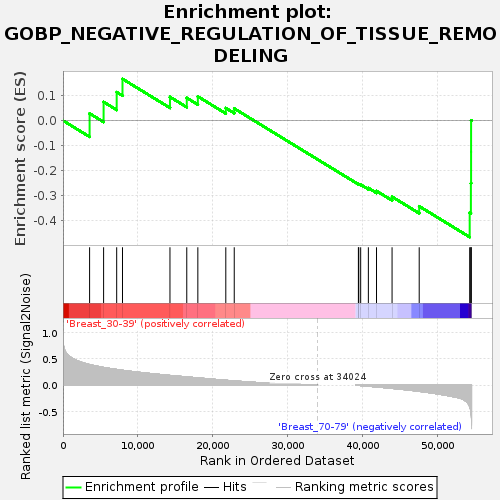
Profile of the Running ES Score & Positions of GeneSet Members on the Rank Ordered List
| Dataset | Breast.Breast.cls #Breast_30-39_versus_Breast_70-79.Breast.cls #Breast_30-39_versus_Breast_70-79_repos |
| Phenotype | Breast.cls#Breast_30-39_versus_Breast_70-79_repos |
| Upregulated in class | Breast_70-79 |
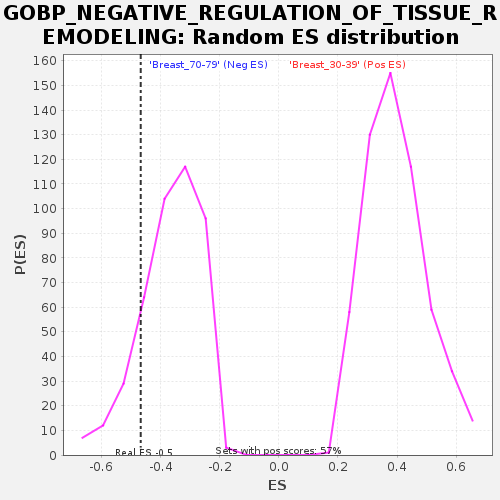
| GeneSet | GOBP_NEGATIVE_REGULATION_OF_TISSUE_REMODELING |
| Enrichment Score (ES) | -0.46692592 |
| Normalized Enrichment Score (NES) | -1.2784176 |
| Nominal p-value | 0.14351852 |
| FDR q-value | 1.0 |
| FWER p-Value | 0.998 |
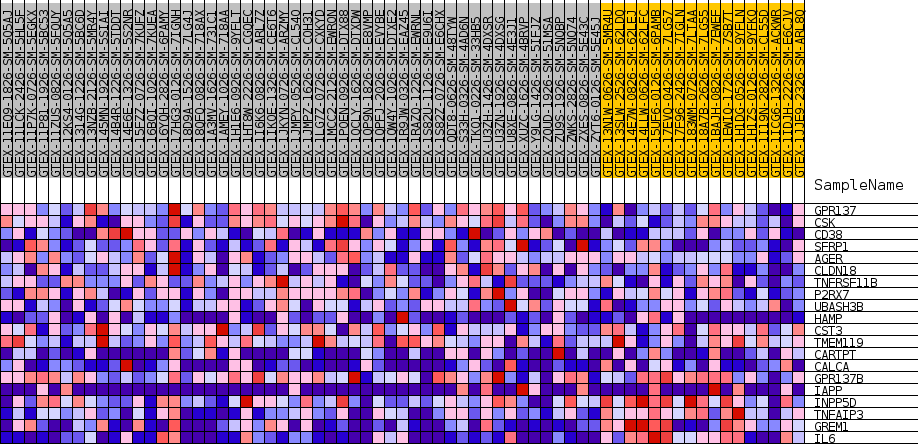
| SYMBOL | TITLE | RANK IN GENE LIST | RANK METRIC SCORE | RUNNING ES | CORE ENRICHMENT | |
|---|---|---|---|---|---|---|
| 1 | GPR137 | NA | 3554 | 0.389 | 0.0286 | No |
| 2 | CSK | NA | 5425 | 0.334 | 0.0747 | No |
| 3 | CD38 | NA | 7173 | 0.296 | 0.1138 | No |
| 4 | SFRP1 | NA | 7949 | 0.280 | 0.1670 | No |
| 5 | AGER | NA | 14292 | 0.183 | 0.0948 | No |
| 6 | CLDN18 | NA | 16537 | 0.155 | 0.0909 | No |
| 7 | TNFRSF11B | NA | 18017 | 0.136 | 0.0967 | No |
| 8 | P2RX7 | NA | 21752 | 0.091 | 0.0501 | No |
| 9 | UBASH3B | NA | 22880 | 0.079 | 0.0484 | No |
| 10 | HAMP | NA | 39468 | -0.005 | -0.2545 | No |
| 11 | CST3 | NA | 39521 | -0.005 | -0.2542 | No |
| 12 | TMEM119 | NA | 39774 | -0.009 | -0.2567 | No |
| 13 | CARTPT | NA | 40801 | -0.022 | -0.2703 | No |
| 14 | CALCA | NA | 41890 | -0.034 | -0.2820 | No |
| 15 | GPR137B | NA | 43967 | -0.062 | -0.3053 | No |
| 16 | IAPP | NA | 47594 | -0.118 | -0.3433 | No |
| 17 | INPP5D | NA | 54339 | -0.407 | -0.3689 | Yes |
| 18 | TNFAIP3 | NA | 54500 | -0.501 | -0.2512 | Yes |
| 19 | GREM1 | NA | 54526 | -0.525 | -0.1253 | Yes |
| 20 | IL6 | NA | 54527 | -0.525 | 0.0012 | Yes |