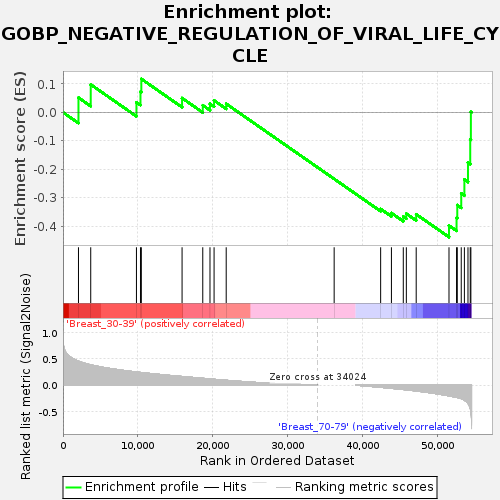
Profile of the Running ES Score & Positions of GeneSet Members on the Rank Ordered List
| Dataset | Breast.Breast.cls #Breast_30-39_versus_Breast_70-79.Breast.cls #Breast_30-39_versus_Breast_70-79_repos |
| Phenotype | Breast.cls#Breast_30-39_versus_Breast_70-79_repos |
| Upregulated in class | Breast_70-79 |
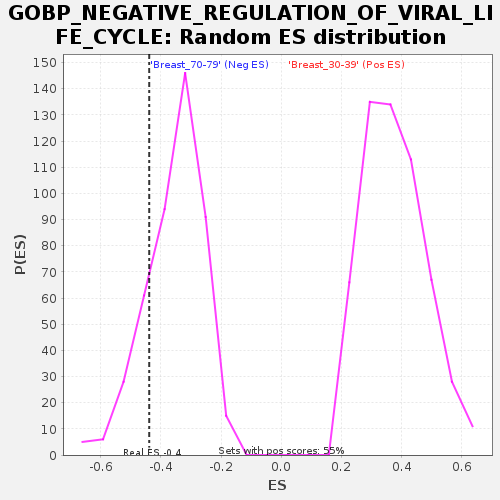
| GeneSet | GOBP_NEGATIVE_REGULATION_OF_VIRAL_LIFE_CYCLE |
| Enrichment Score (ES) | -0.43875563 |
| Normalized Enrichment Score (NES) | -1.2349566 |
| Nominal p-value | 0.17937219 |
| FDR q-value | 1.0 |
| FWER p-Value | 0.998 |
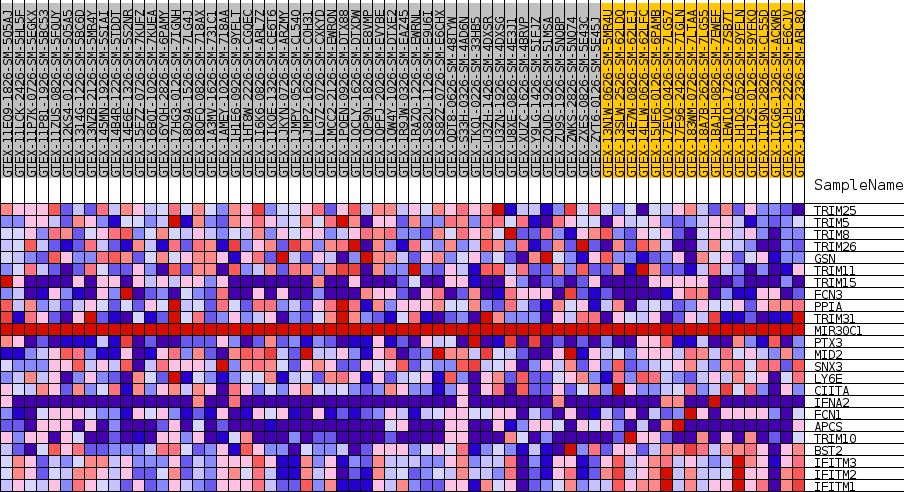
| SYMBOL | TITLE | RANK IN GENE LIST | RANK METRIC SCORE | RUNNING ES | CORE ENRICHMENT | |
|---|---|---|---|---|---|---|
| 1 | TRIM25 | NA | 2067 | 0.452 | 0.0519 | No |
| 2 | TRIM5 | NA | 3705 | 0.384 | 0.0981 | No |
| 3 | TRIM8 | NA | 9813 | 0.247 | 0.0353 | No |
| 4 | TRIM26 | NA | 10352 | 0.239 | 0.0728 | No |
| 5 | GSN | NA | 10466 | 0.237 | 0.1178 | No |
| 6 | TRIM11 | NA | 15909 | 0.162 | 0.0503 | No |
| 7 | TRIM15 | NA | 18675 | 0.128 | 0.0251 | No |
| 8 | FCN3 | NA | 19639 | 0.116 | 0.0304 | No |
| 9 | PPIA | NA | 20186 | 0.109 | 0.0420 | No |
| 10 | TRIM31 | NA | 21806 | 0.090 | 0.0302 | No |
| 11 | MIR30C1 | NA | 36230 | 0.000 | -0.2341 | No |
| 12 | PTX3 | NA | 42442 | -0.041 | -0.3398 | No |
| 13 | MID2 | NA | 43882 | -0.060 | -0.3541 | No |
| 14 | SNX3 | NA | 45467 | -0.083 | -0.3667 | No |
| 15 | LY6E | NA | 45875 | -0.089 | -0.3564 | No |
| 16 | CIITA | NA | 47192 | -0.111 | -0.3585 | No |
| 17 | IFNA2 | NA | 51574 | -0.204 | -0.3982 | Yes |
| 18 | FCN1 | NA | 52584 | -0.231 | -0.3708 | Yes |
| 19 | APCS | NA | 52681 | -0.234 | -0.3262 | Yes |
| 20 | TRIM10 | NA | 53211 | -0.255 | -0.2852 | Yes |
| 21 | BST2 | NA | 53631 | -0.285 | -0.2362 | Yes |
| 22 | IFITM3 | NA | 54111 | -0.345 | -0.1765 | Yes |
| 23 | IFITM2 | NA | 54412 | -0.438 | -0.0950 | Yes |
| 24 | IFITM1 | NA | 54497 | -0.495 | 0.0017 | Yes |