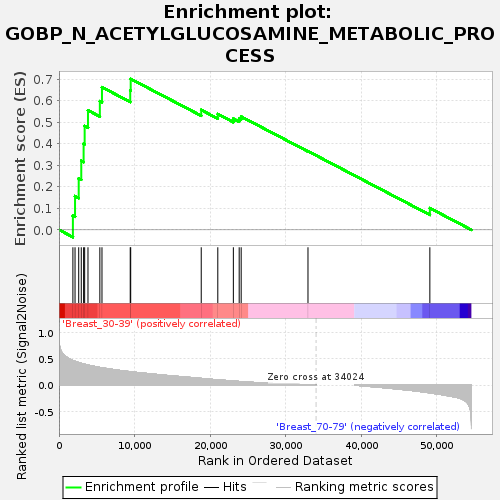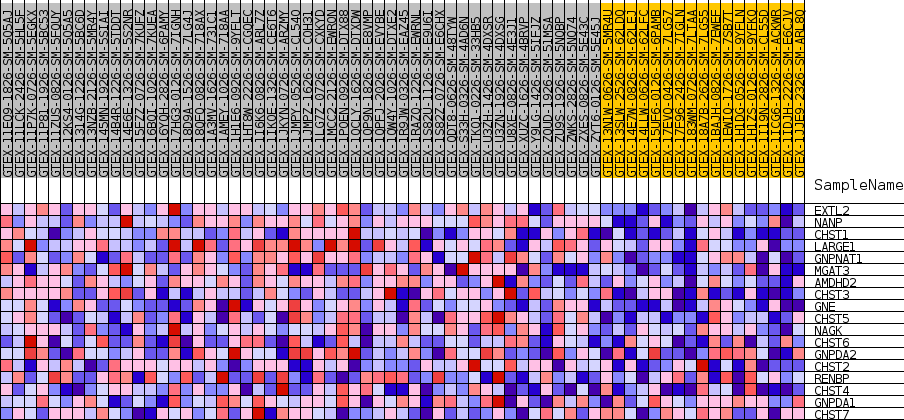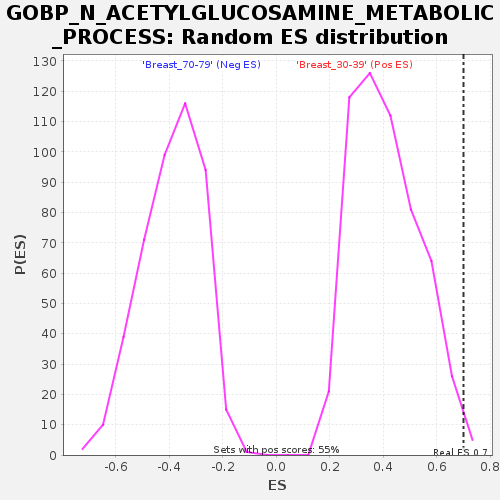
Profile of the Running ES Score & Positions of GeneSet Members on the Rank Ordered List
| Dataset | Breast.Breast.cls #Breast_30-39_versus_Breast_70-79.Breast.cls #Breast_30-39_versus_Breast_70-79_repos |
| Phenotype | Breast.cls#Breast_30-39_versus_Breast_70-79_repos |
| Upregulated in class | Breast_30-39 |
| GeneSet | GOBP_N_ACETYLGLUCOSAMINE_METABOLIC_PROCESS |
| Enrichment Score (ES) | 0.70048755 |
| Normalized Enrichment Score (NES) | 1.706649 |
| Nominal p-value | 0.009041592 |
| FDR q-value | 0.35790572 |
| FWER p-Value | 0.63 |

| SYMBOL | TITLE | RANK IN GENE LIST | RANK METRIC SCORE | RUNNING ES | CORE ENRICHMENT | |
|---|---|---|---|---|---|---|
| 1 | EXTL2 | NA | 1839 | 0.466 | 0.0658 | Yes |
| 2 | NANP | NA | 2123 | 0.450 | 0.1566 | Yes |
| 3 | CHST1 | NA | 2609 | 0.427 | 0.2388 | Yes |
| 4 | LARGE1 | NA | 2948 | 0.411 | 0.3203 | Yes |
| 5 | GNPNAT1 | NA | 3258 | 0.400 | 0.4000 | Yes |
| 6 | MGAT3 | NA | 3396 | 0.395 | 0.4818 | Yes |
| 7 | AMDHD2 | NA | 3836 | 0.379 | 0.5546 | Yes |
| 8 | CHST3 | NA | 5407 | 0.334 | 0.5972 | Yes |
| 9 | GNE | NA | 5689 | 0.328 | 0.6620 | Yes |
| 10 | CHST5 | NA | 9429 | 0.254 | 0.6476 | Yes |
| 11 | NAGK | NA | 9492 | 0.253 | 0.7005 | Yes |
| 12 | CHST6 | NA | 18828 | 0.126 | 0.5563 | No |
| 13 | GNPDA2 | NA | 21022 | 0.099 | 0.5373 | No |
| 14 | CHST2 | NA | 23081 | 0.076 | 0.5159 | No |
| 15 | RENBP | NA | 23853 | 0.068 | 0.5164 | No |
| 16 | CHST4 | NA | 24116 | 0.066 | 0.5256 | No |
| 17 | GNPDA1 | NA | 32960 | 0.007 | 0.3650 | No |
| 18 | CHST7 | NA | 49093 | -0.147 | 0.1007 | No |

