Profile of the Running ES Score & Positions of GeneSet Members on the Rank Ordered List
| Dataset | Breast.Breast.cls #Breast_30-39_versus_Breast_70-79.Breast.cls #Breast_30-39_versus_Breast_70-79_repos |
| Phenotype | Breast.cls#Breast_30-39_versus_Breast_70-79_repos |
| Upregulated in class | Breast_70-79 |
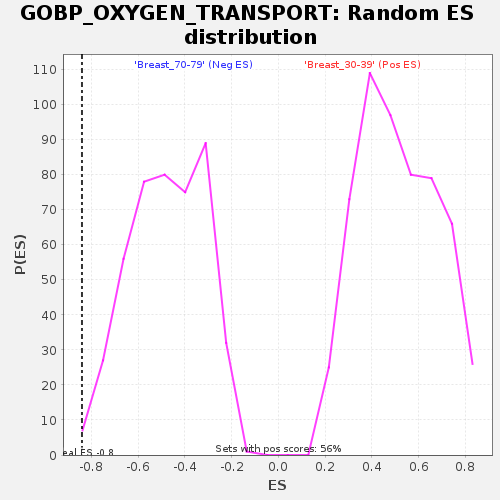
| GeneSet | GOBP_OXYGEN_TRANSPORT |
| Enrichment Score (ES) | -0.84023994 |
| Normalized Enrichment Score (NES) | -1.7649074 |
| Nominal p-value | 0.006741573 |
| FDR q-value | 0.7366312 |
| FWER p-Value | 0.498 |
| SYMBOL | TITLE | RANK IN GENE LIST | RANK METRIC SCORE | RUNNING ES | CORE ENRICHMENT | |
|---|---|---|---|---|---|---|
| 1 | MB | NA | 15114 | 0.172 | -0.2444 | No |
| 2 | HBZ | NA | 15937 | 0.162 | -0.2288 | No |
| 3 | IPCEF1 | NA | 17863 | 0.138 | -0.2379 | No |
| 4 | HBE1 | NA | 48078 | -0.127 | -0.7675 | No |
| 5 | HBG1 | NA | 52049 | -0.216 | -0.7994 | Yes |
| 6 | NGB | NA | 52137 | -0.218 | -0.7597 | Yes |
| 7 | MYC | NA | 54143 | -0.351 | -0.7300 | Yes |
| 8 | HBG2 | NA | 54189 | -0.361 | -0.6626 | Yes |
| 9 | CYGB | NA | 54402 | -0.435 | -0.5842 | Yes |
| 10 | HBA2 | NA | 54440 | -0.457 | -0.4986 | Yes |
| 11 | HBD | NA | 54482 | -0.482 | -0.4082 | Yes |
| 12 | HBM | NA | 54507 | -0.506 | -0.3130 | Yes |
| 13 | HBB | NA | 54533 | -0.538 | -0.2117 | Yes |
| 14 | HBA1 | NA | 54541 | -0.543 | -0.1092 | Yes |
| 15 | HBQ1 | NA | 54562 | -0.583 | 0.0005 | Yes |