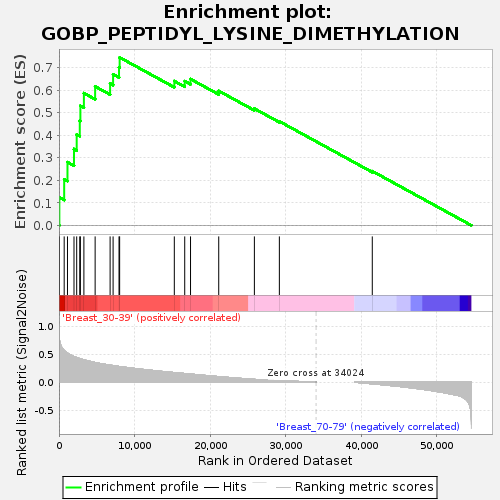
Profile of the Running ES Score & Positions of GeneSet Members on the Rank Ordered List
| Dataset | Breast.Breast.cls #Breast_30-39_versus_Breast_70-79.Breast.cls #Breast_30-39_versus_Breast_70-79_repos |
| Phenotype | Breast.cls#Breast_30-39_versus_Breast_70-79_repos |
| Upregulated in class | Breast_30-39 |
| GeneSet | GOBP_PEPTIDYL_LYSINE_DIMETHYLATION |
| Enrichment Score (ES) | 0.74443907 |
| Normalized Enrichment Score (NES) | 1.6352663 |
| Nominal p-value | 0.003868472 |
| FDR q-value | 0.24006383 |
| FWER p-Value | 0.834 |
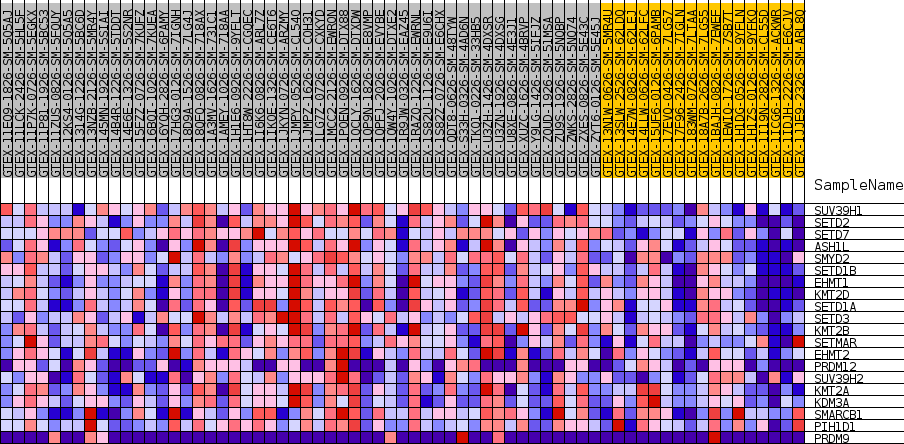
| SYMBOL | TITLE | RANK IN GENE LIST | RANK METRIC SCORE | RUNNING ES | CORE ENRICHMENT | |
|---|---|---|---|---|---|---|
| 1 | SUV39H1 | NA | 47 | 0.770 | 0.1241 | Yes |
| 2 | SETD2 | NA | 686 | 0.564 | 0.2039 | Yes |
| 3 | SETD7 | NA | 1122 | 0.519 | 0.2802 | Yes |
| 4 | ASH1L | NA | 1985 | 0.457 | 0.3385 | Yes |
| 5 | SMYD2 | NA | 2342 | 0.439 | 0.4032 | Yes |
| 6 | SETD1B | NA | 2750 | 0.420 | 0.4639 | Yes |
| 7 | EHMT1 | NA | 2830 | 0.416 | 0.5300 | Yes |
| 8 | KMT2D | NA | 3295 | 0.398 | 0.5861 | Yes |
| 9 | SETD1A | NA | 4783 | 0.351 | 0.6159 | Yes |
| 10 | SETD3 | NA | 6765 | 0.304 | 0.6289 | Yes |
| 11 | KMT2B | NA | 7161 | 0.296 | 0.6697 | Yes |
| 12 | SETMAR | NA | 7946 | 0.280 | 0.7007 | Yes |
| 13 | EHMT2 | NA | 8028 | 0.278 | 0.7444 | Yes |
| 14 | PRDM12 | NA | 15265 | 0.171 | 0.6395 | No |
| 15 | SUV39H2 | NA | 16643 | 0.154 | 0.6392 | No |
| 16 | KMT2A | NA | 17412 | 0.144 | 0.6486 | No |
| 17 | KDM3A | NA | 21145 | 0.098 | 0.5961 | No |
| 18 | SMARCB1 | NA | 25864 | 0.049 | 0.5175 | No |
| 19 | PIH1D1 | NA | 29171 | 0.025 | 0.4610 | No |
| 20 | PRDM9 | NA | 41472 | -0.029 | 0.2404 | No |