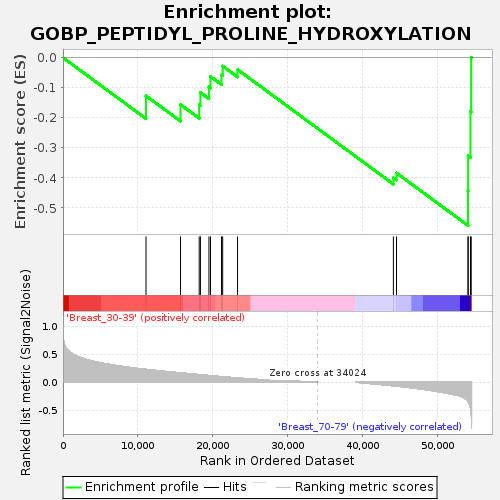
Profile of the Running ES Score & Positions of GeneSet Members on the Rank Ordered List
| Dataset | Breast.Breast.cls #Breast_30-39_versus_Breast_70-79.Breast.cls #Breast_30-39_versus_Breast_70-79_repos |
| Phenotype | Breast.cls#Breast_30-39_versus_Breast_70-79_repos |
| Upregulated in class | Breast_70-79 |
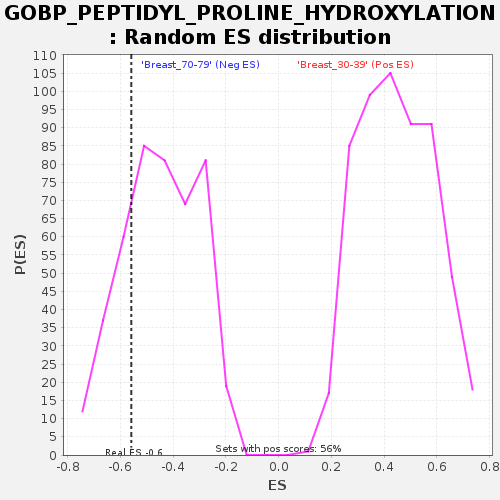
| GeneSet | GOBP_PEPTIDYL_PROLINE_HYDROXYLATION |
| Enrichment Score (ES) | -0.5589314 |
| Normalized Enrichment Score (NES) | -1.2522678 |
| Nominal p-value | 0.22522523 |
| FDR q-value | 1.0 |
| FWER p-Value | 0.998 |
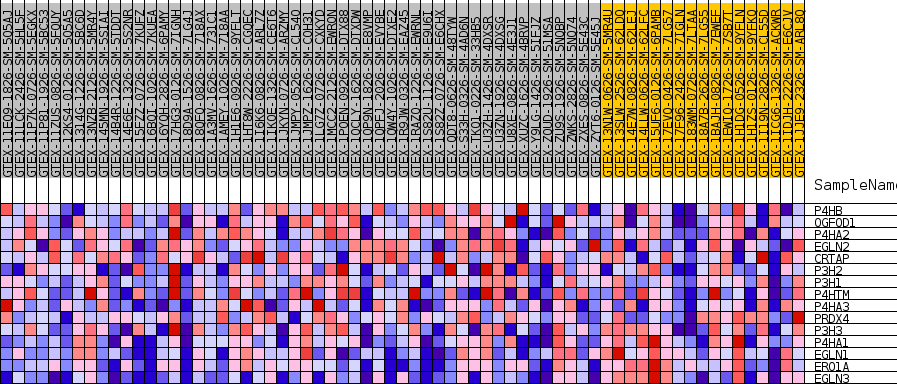
| SYMBOL | TITLE | RANK IN GENE LIST | RANK METRIC SCORE | RUNNING ES | CORE ENRICHMENT | |
|---|---|---|---|---|---|---|
| 1 | P4HB | NA | 11090 | 0.228 | -0.1270 | No |
| 2 | OGFOD1 | NA | 15702 | 0.165 | -0.1562 | No |
| 3 | P4HA2 | NA | 18197 | 0.134 | -0.1570 | No |
| 4 | EGLN2 | NA | 18363 | 0.132 | -0.1159 | No |
| 5 | CRTAP | NA | 19500 | 0.118 | -0.0974 | No |
| 6 | P3H2 | NA | 19705 | 0.115 | -0.0627 | No |
| 7 | P3H1 | NA | 21174 | 0.098 | -0.0570 | No |
| 8 | P4HTM | NA | 21337 | 0.096 | -0.0280 | No |
| 9 | P4HA3 | NA | 23323 | 0.074 | -0.0396 | No |
| 10 | PRDX4 | NA | 44143 | -0.064 | -0.3997 | No |
| 11 | P3H3 | NA | 44560 | -0.070 | -0.3839 | No |
| 12 | P4HA1 | NA | 54116 | -0.345 | -0.4434 | Yes |
| 13 | EGLN1 | NA | 54136 | -0.350 | -0.3267 | Yes |
| 14 | ERO1A | NA | 54444 | -0.458 | -0.1791 | Yes |
| 15 | EGLN3 | NA | 54542 | -0.543 | 0.0009 | Yes |