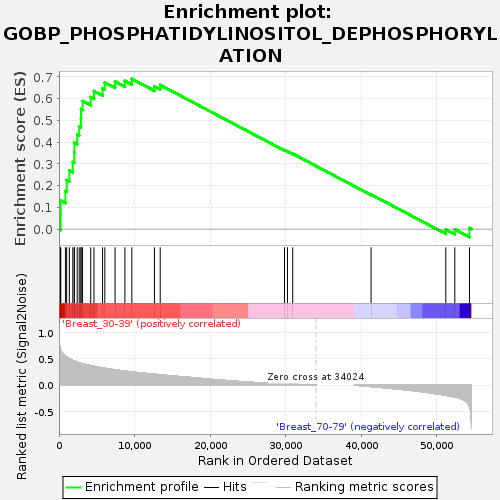
Profile of the Running ES Score & Positions of GeneSet Members on the Rank Ordered List
| Dataset | Breast.Breast.cls #Breast_30-39_versus_Breast_70-79.Breast.cls #Breast_30-39_versus_Breast_70-79_repos |
| Phenotype | Breast.cls#Breast_30-39_versus_Breast_70-79_repos |
| Upregulated in class | Breast_30-39 |
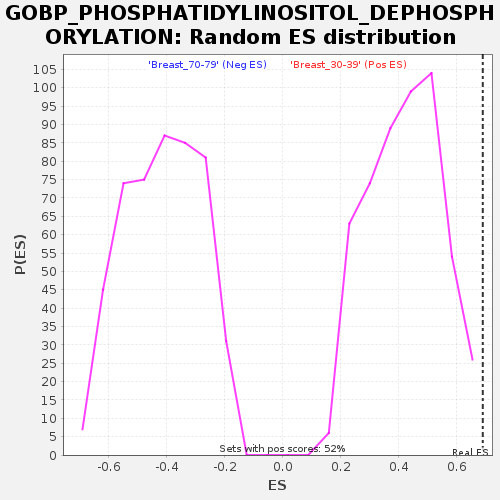
| GeneSet | GOBP_PHOSPHATIDYLINOSITOL_DEPHOSPHORYLATION |
| Enrichment Score (ES) | 0.6904992 |
| Normalized Enrichment Score (NES) | 1.6459237 |
| Nominal p-value | 0.0 |
| FDR q-value | 0.24097903 |
| FWER p-Value | 0.817 |
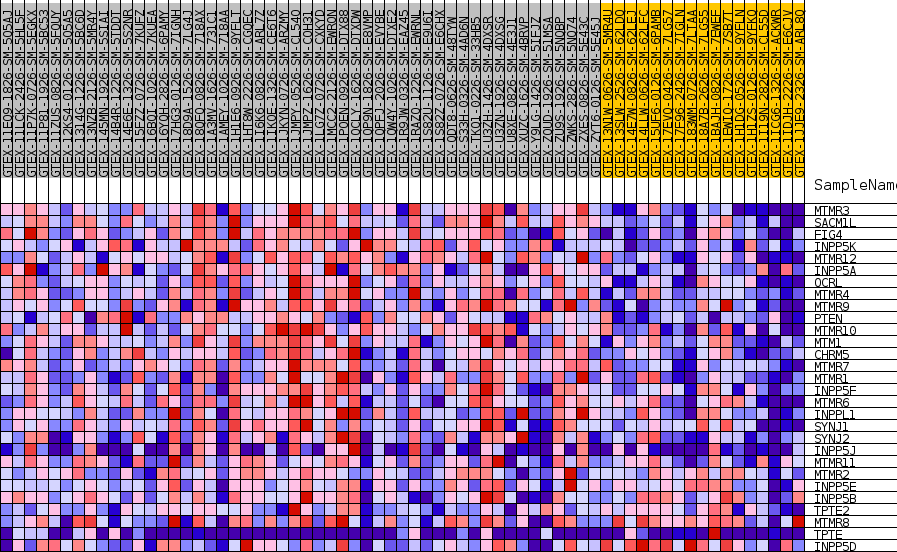
| SYMBOL | TITLE | RANK IN GENE LIST | RANK METRIC SCORE | RUNNING ES | CORE ENRICHMENT | |
|---|---|---|---|---|---|---|
| 1 | MTMR3 | NA | 209 | 0.668 | 0.0640 | Yes |
| 2 | SACM1L | NA | 227 | 0.660 | 0.1307 | Yes |
| 3 | FIG4 | NA | 851 | 0.545 | 0.1747 | Yes |
| 4 | INPP5K | NA | 1017 | 0.528 | 0.2253 | Yes |
| 5 | MTMR12 | NA | 1368 | 0.497 | 0.2694 | Yes |
| 6 | INPP5A | NA | 1825 | 0.466 | 0.3084 | Yes |
| 7 | OCRL | NA | 2023 | 0.454 | 0.3509 | Yes |
| 8 | MTMR4 | NA | 2037 | 0.454 | 0.3968 | Yes |
| 9 | MTMR9 | NA | 2410 | 0.435 | 0.4341 | Yes |
| 10 | PTEN | NA | 2673 | 0.423 | 0.4723 | Yes |
| 11 | MTMR10 | NA | 2904 | 0.413 | 0.5100 | Yes |
| 12 | MTM1 | NA | 2916 | 0.412 | 0.5517 | Yes |
| 13 | CHRM5 | NA | 3119 | 0.405 | 0.5890 | Yes |
| 14 | MTMR7 | NA | 4199 | 0.368 | 0.6066 | Yes |
| 15 | MTMR1 | NA | 4630 | 0.356 | 0.6348 | Yes |
| 16 | INPP5F | NA | 5763 | 0.326 | 0.6472 | Yes |
| 17 | MTMR6 | NA | 6066 | 0.319 | 0.6741 | Yes |
| 18 | INPPL1 | NA | 7421 | 0.290 | 0.6787 | Yes |
| 19 | SYNJ1 | NA | 8722 | 0.266 | 0.6819 | Yes |
| 20 | SYNJ2 | NA | 9642 | 0.250 | 0.6905 | Yes |
| 21 | INPP5J | NA | 12632 | 0.206 | 0.6566 | No |
| 22 | MTMR11 | NA | 13399 | 0.195 | 0.6624 | No |
| 23 | MTMR2 | NA | 29851 | 0.021 | 0.3630 | No |
| 24 | INPP5E | NA | 30241 | 0.019 | 0.3578 | No |
| 25 | INPP5B | NA | 30940 | 0.016 | 0.3466 | No |
| 26 | TPTE2 | NA | 41312 | -0.027 | 0.1593 | No |
| 27 | MTMR8 | NA | 51205 | -0.194 | -0.0022 | No |
| 28 | TPTE | NA | 52400 | -0.226 | -0.0012 | No |
| 29 | INPP5D | NA | 54339 | -0.407 | 0.0046 | No |