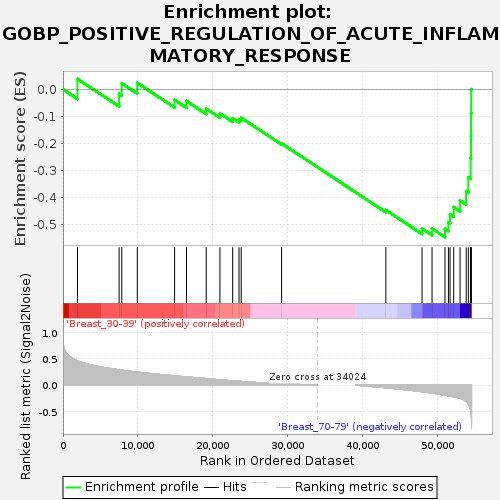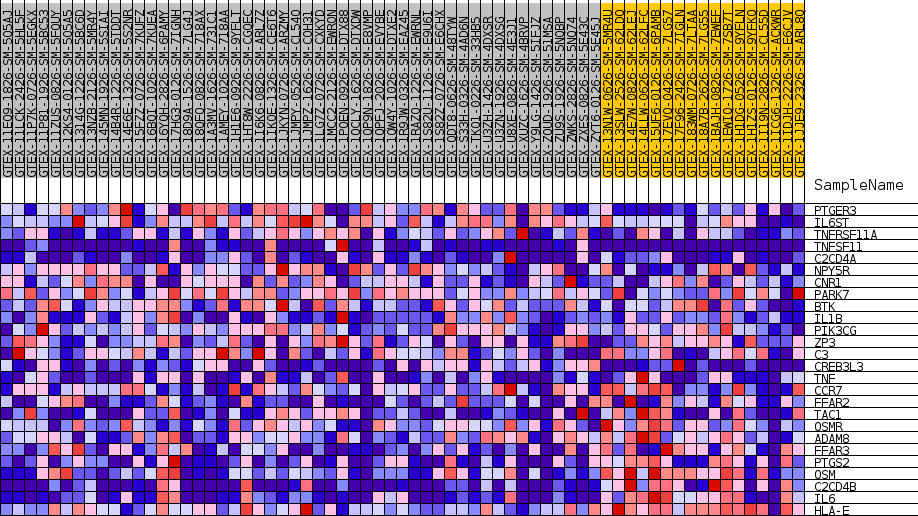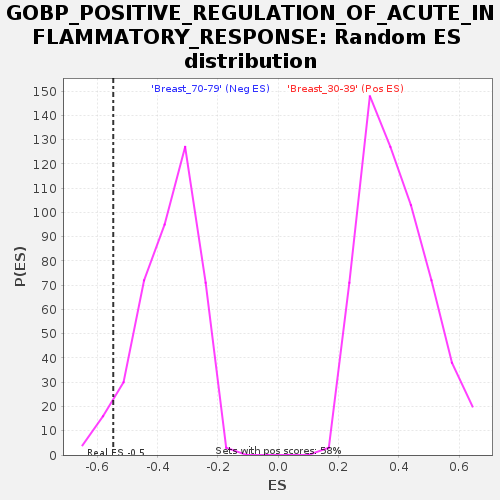
Profile of the Running ES Score & Positions of GeneSet Members on the Rank Ordered List
| Dataset | Breast.Breast.cls #Breast_30-39_versus_Breast_70-79.Breast.cls #Breast_30-39_versus_Breast_70-79_repos |
| Phenotype | Breast.cls#Breast_30-39_versus_Breast_70-79_repos |
| Upregulated in class | Breast_70-79 |
| GeneSet | GOBP_POSITIVE_REGULATION_OF_ACUTE_INFLAMMATORY_RESPONSE |
| Enrichment Score (ES) | -0.5475244 |
| Normalized Enrichment Score (NES) | -1.504035 |
| Nominal p-value | 0.04784689 |
| FDR q-value | 0.74357784 |
| FWER p-Value | 0.96 |

| SYMBOL | TITLE | RANK IN GENE LIST | RANK METRIC SCORE | RUNNING ES | CORE ENRICHMENT | |
|---|---|---|---|---|---|---|
| 1 | PTGER3 | NA | 1931 | 0.460 | 0.0388 | No |
| 2 | IL6ST | NA | 7499 | 0.289 | -0.0166 | No |
| 3 | TNFRSF11A | NA | 7851 | 0.282 | 0.0225 | No |
| 4 | TNFSF11 | NA | 9926 | 0.246 | 0.0242 | No |
| 5 | C2CD4A | NA | 14911 | 0.175 | -0.0390 | No |
| 6 | NPY5R | NA | 16498 | 0.155 | -0.0429 | No |
| 7 | CNR1 | NA | 19137 | 0.122 | -0.0716 | No |
| 8 | PARK7 | NA | 20966 | 0.100 | -0.0890 | No |
| 9 | BTK | NA | 22671 | 0.081 | -0.1072 | No |
| 10 | IL1B | NA | 23517 | 0.072 | -0.1111 | No |
| 11 | PIK3CG | NA | 23809 | 0.069 | -0.1053 | No |
| 12 | ZP3 | NA | 29209 | 0.025 | -0.2003 | No |
| 13 | C3 | NA | 43139 | -0.050 | -0.4474 | No |
| 14 | CREB3L3 | NA | 47977 | -0.125 | -0.5159 | No |
| 15 | TNF | NA | 49309 | -0.151 | -0.5159 | No |
| 16 | CCR7 | NA | 51037 | -0.190 | -0.5168 | Yes |
| 17 | FFAR2 | NA | 51499 | -0.202 | -0.4927 | Yes |
| 18 | TAC1 | NA | 51715 | -0.208 | -0.4631 | Yes |
| 19 | OSMR | NA | 52205 | -0.221 | -0.4365 | Yes |
| 20 | ADAM8 | NA | 53053 | -0.248 | -0.4120 | Yes |
| 21 | FFAR3 | NA | 53872 | -0.308 | -0.3772 | Yes |
| 22 | PTGS2 | NA | 54159 | -0.354 | -0.3254 | Yes |
| 23 | OSM | NA | 54461 | -0.471 | -0.2549 | Yes |
| 24 | C2CD4B | NA | 54517 | -0.516 | -0.1727 | Yes |
| 25 | IL6 | NA | 54527 | -0.525 | -0.0880 | Yes |
| 26 | HLA-E | NA | 54547 | -0.553 | 0.0008 | Yes |

