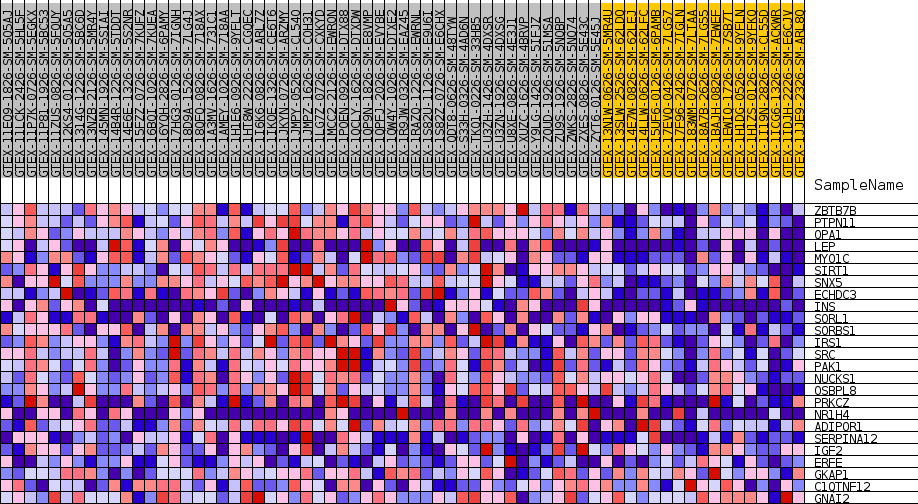
Profile of the Running ES Score & Positions of GeneSet Members on the Rank Ordered List
| Dataset | Breast.Breast.cls #Breast_30-39_versus_Breast_70-79.Breast.cls #Breast_30-39_versus_Breast_70-79_repos |
| Phenotype | Breast.cls#Breast_30-39_versus_Breast_70-79_repos |
| Upregulated in class | Breast_30-39 |
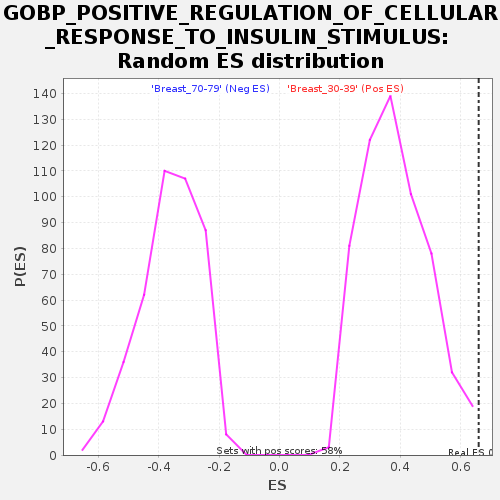
| GeneSet | GOBP_POSITIVE_REGULATION_OF_CELLULAR_RESPONSE_TO_INSULIN_STIMULUS |
| Enrichment Score (ES) | 0.6594796 |
| Normalized Enrichment Score (NES) | 1.7250957 |
| Nominal p-value | 0.0017391305 |
| FDR q-value | 0.45794767 |
| FWER p-Value | 0.565 |
| SYMBOL | TITLE | RANK IN GENE LIST | RANK METRIC SCORE | RUNNING ES | CORE ENRICHMENT | |
|---|---|---|---|---|---|---|
| 1 | ZBTB7B | NA | 421 | 0.610 | 0.0837 | Yes |
| 2 | PTPN11 | NA | 1141 | 0.517 | 0.1480 | Yes |
| 3 | OPA1 | NA | 1153 | 0.516 | 0.2253 | Yes |
| 4 | LEP | NA | 1684 | 0.477 | 0.2871 | Yes |
| 5 | MYO1C | NA | 1832 | 0.466 | 0.3543 | Yes |
| 6 | SIRT1 | NA | 2723 | 0.421 | 0.4011 | Yes |
| 7 | SNX5 | NA | 3720 | 0.383 | 0.4403 | Yes |
| 8 | ECHDC3 | NA | 5052 | 0.344 | 0.4676 | Yes |
| 9 | INS | NA | 5395 | 0.335 | 0.5115 | Yes |
| 10 | SORL1 | NA | 5570 | 0.331 | 0.5579 | Yes |
| 11 | SORBS1 | NA | 5768 | 0.326 | 0.6032 | Yes |
| 12 | IRS1 | NA | 6700 | 0.305 | 0.6318 | Yes |
| 13 | SRC | NA | 8379 | 0.272 | 0.6419 | Yes |
| 14 | PAK1 | NA | 9677 | 0.250 | 0.6556 | Yes |
| 15 | NUCKS1 | NA | 11303 | 0.224 | 0.6595 | Yes |
| 16 | OSBPL8 | NA | 13867 | 0.188 | 0.6408 | No |
| 17 | PRKCZ | NA | 17376 | 0.145 | 0.5982 | No |
| 18 | NR1H4 | NA | 18353 | 0.132 | 0.6001 | No |
| 19 | ADIPOR1 | NA | 23859 | 0.068 | 0.5095 | No |
| 20 | SERPINA12 | NA | 25564 | 0.052 | 0.4860 | No |
| 21 | IGF2 | NA | 40933 | -0.023 | 0.2078 | No |
| 22 | ERFE | NA | 41455 | -0.029 | 0.2026 | No |
| 23 | GKAP1 | NA | 41733 | -0.032 | 0.2024 | No |
| 24 | C1QTNF12 | NA | 44539 | -0.070 | 0.1615 | No |
| 25 | GNAI2 | NA | 49326 | -0.151 | 0.0965 | No |