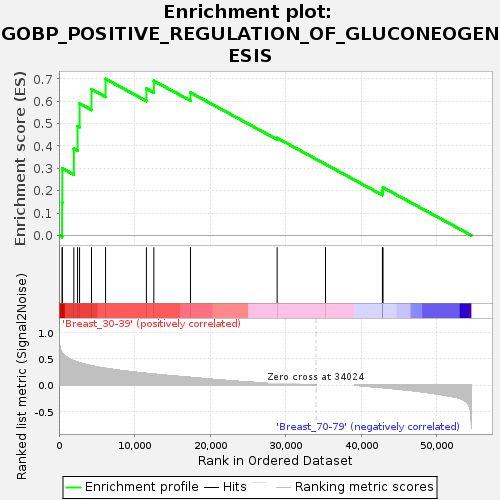
Profile of the Running ES Score & Positions of GeneSet Members on the Rank Ordered List
| Dataset | Breast.Breast.cls #Breast_30-39_versus_Breast_70-79.Breast.cls #Breast_30-39_versus_Breast_70-79_repos |
| Phenotype | Breast.cls#Breast_30-39_versus_Breast_70-79_repos |
| Upregulated in class | Breast_30-39 |
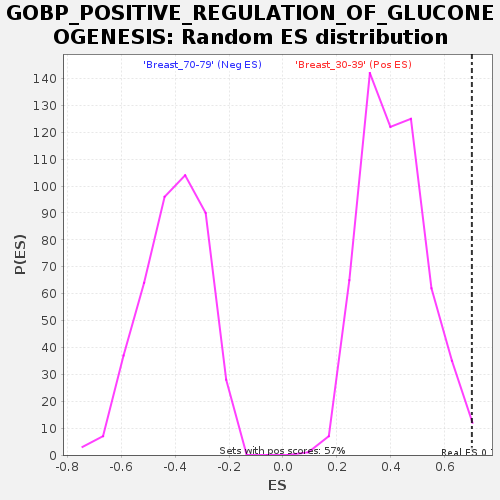
| GeneSet | GOBP_POSITIVE_REGULATION_OF_GLUCONEOGENESIS |
| Enrichment Score (ES) | 0.7001093 |
| Normalized Enrichment Score (NES) | 1.7015439 |
| Nominal p-value | 0.010507881 |
| FDR q-value | 0.324596 |
| FWER p-Value | 0.645 |
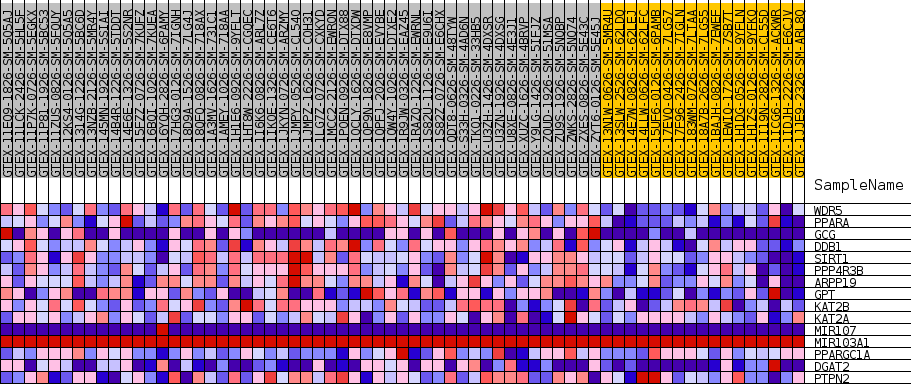
| SYMBOL | TITLE | RANK IN GENE LIST | RANK METRIC SCORE | RUNNING ES | CORE ENRICHMENT | |
|---|---|---|---|---|---|---|
| 1 | WDR5 | NA | 412 | 0.611 | 0.1471 | Yes |
| 2 | PPARA | NA | 438 | 0.605 | 0.2999 | Yes |
| 3 | GCG | NA | 1965 | 0.458 | 0.3879 | Yes |
| 4 | DDB1 | NA | 2456 | 0.433 | 0.4886 | Yes |
| 5 | SIRT1 | NA | 2723 | 0.421 | 0.5903 | Yes |
| 6 | PPP4R3B | NA | 4301 | 0.365 | 0.6539 | Yes |
| 7 | ARPP19 | NA | 6164 | 0.317 | 0.7001 | Yes |
| 8 | GPT | NA | 11569 | 0.221 | 0.6570 | No |
| 9 | KAT2B | NA | 12557 | 0.207 | 0.6913 | No |
| 10 | KAT2A | NA | 17405 | 0.144 | 0.6390 | No |
| 11 | MIR107 | NA | 28878 | 0.027 | 0.4356 | No |
| 12 | MIR103A1 | NA | 35279 | 0.000 | 0.3184 | No |
| 13 | PPARGC1A | NA | 42813 | -0.046 | 0.1920 | No |
| 14 | DGAT2 | NA | 42859 | -0.047 | 0.2030 | No |
| 15 | PTPN2 | NA | 42872 | -0.047 | 0.2147 | No |