Profile of the Running ES Score & Positions of GeneSet Members on the Rank Ordered List
| Dataset | Breast.Breast.cls #Breast_30-39_versus_Breast_70-79.Breast.cls #Breast_30-39_versus_Breast_70-79_repos |
| Phenotype | Breast.cls#Breast_30-39_versus_Breast_70-79_repos |
| Upregulated in class | Breast_30-39 |
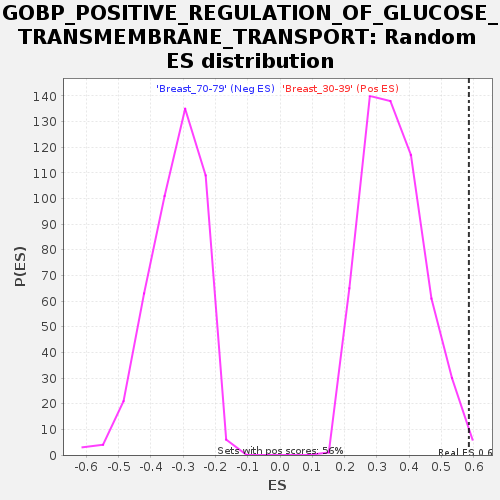
| GeneSet | GOBP_POSITIVE_REGULATION_OF_GLUCOSE_TRANSMEMBRANE_TRANSPORT |
| Enrichment Score (ES) | 0.58532685 |
| Normalized Enrichment Score (NES) | 1.6650022 |
| Nominal p-value | 0.007168459 |
| FDR q-value | 0.24078465 |
| FWER p-Value | 0.763 |
| SYMBOL | TITLE | RANK IN GENE LIST | RANK METRIC SCORE | RUNNING ES | CORE ENRICHMENT | |
|---|---|---|---|---|---|---|
| 1 | PTPN11 | NA | 1141 | 0.517 | 0.0278 | Yes |
| 2 | C2CD5 | NA | 1305 | 0.503 | 0.0722 | Yes |
| 3 | AKT2 | NA | 1358 | 0.498 | 0.1181 | Yes |
| 4 | AKT1 | NA | 1390 | 0.496 | 0.1643 | Yes |
| 5 | KLF15 | NA | 2418 | 0.435 | 0.1864 | Yes |
| 6 | PIK3R1 | NA | 2739 | 0.420 | 0.2202 | Yes |
| 7 | MAPK14 | NA | 4118 | 0.371 | 0.2298 | Yes |
| 8 | OPN3 | NA | 4244 | 0.367 | 0.2621 | Yes |
| 9 | CAPN10 | NA | 4702 | 0.353 | 0.2870 | Yes |
| 10 | INS | NA | 5395 | 0.335 | 0.3059 | Yes |
| 11 | CREBL2 | NA | 5424 | 0.334 | 0.3368 | Yes |
| 12 | SORBS1 | NA | 5768 | 0.326 | 0.3612 | Yes |
| 13 | ARPP19 | NA | 6164 | 0.317 | 0.3839 | Yes |
| 14 | IRS1 | NA | 6700 | 0.305 | 0.4028 | Yes |
| 15 | PRKCI | NA | 6833 | 0.302 | 0.4289 | Yes |
| 16 | IRS2 | NA | 7052 | 0.298 | 0.4529 | Yes |
| 17 | APPL1 | NA | 8192 | 0.275 | 0.4580 | Yes |
| 18 | ADIPOQ | NA | 8737 | 0.266 | 0.4731 | Yes |
| 19 | INSR | NA | 9620 | 0.250 | 0.4805 | Yes |
| 20 | CLTCL1 | NA | 10491 | 0.237 | 0.4869 | Yes |
| 21 | RNASEL | NA | 10634 | 0.234 | 0.5064 | Yes |
| 22 | ADIPOR2 | NA | 10925 | 0.230 | 0.5227 | Yes |
| 23 | TERT | NA | 11079 | 0.228 | 0.5414 | Yes |
| 24 | BRAF | NA | 11673 | 0.219 | 0.5511 | Yes |
| 25 | RHOQ | NA | 12252 | 0.211 | 0.5605 | Yes |
| 26 | GH1 | NA | 12785 | 0.204 | 0.5699 | Yes |
| 27 | OSBPL8 | NA | 13867 | 0.188 | 0.5679 | Yes |
| 28 | FGF19 | NA | 14713 | 0.178 | 0.5691 | Yes |
| 29 | CLIP3 | NA | 14738 | 0.177 | 0.5853 | Yes |
| 30 | RAP1A | NA | 15821 | 0.164 | 0.5809 | No |
| 31 | PTH | NA | 17567 | 0.142 | 0.5623 | No |
| 32 | MEF2A | NA | 22129 | 0.087 | 0.4869 | No |
| 33 | IGF1 | NA | 24322 | 0.064 | 0.4527 | No |
| 34 | OCLN | NA | 24346 | 0.064 | 0.4583 | No |
| 35 | GIP | NA | 33232 | 0.006 | 0.2959 | No |
| 36 | ERFE | NA | 41455 | -0.029 | 0.1479 | No |
| 37 | GPC3 | NA | 42028 | -0.036 | 0.1408 | No |
| 38 | POU4F2 | NA | 42754 | -0.045 | 0.1318 | No |
| 39 | C3 | NA | 43139 | -0.050 | 0.1295 | No |
| 40 | ITLN1 | NA | 43696 | -0.058 | 0.1247 | No |
| 41 | C1QTNF12 | NA | 44539 | -0.070 | 0.1159 | No |
| 42 | FGF21 | NA | 49225 | -0.149 | 0.0441 | No |
| 43 | NR4A3 | NA | 53426 | -0.270 | -0.0075 | No |
| 44 | NFE2L2 | NA | 53852 | -0.306 | 0.0135 | No |