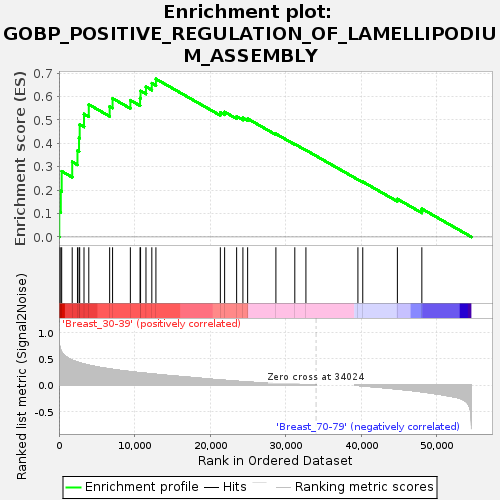
Profile of the Running ES Score & Positions of GeneSet Members on the Rank Ordered List
| Dataset | Breast.Breast.cls #Breast_30-39_versus_Breast_70-79.Breast.cls #Breast_30-39_versus_Breast_70-79_repos |
| Phenotype | Breast.cls#Breast_30-39_versus_Breast_70-79_repos |
| Upregulated in class | Breast_30-39 |
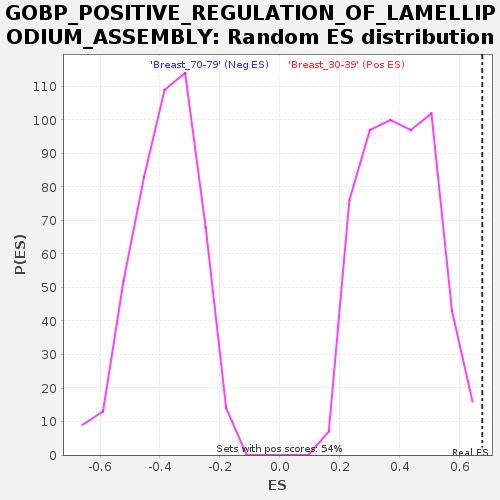
| GeneSet | GOBP_POSITIVE_REGULATION_OF_LAMELLIPODIUM_ASSEMBLY |
| Enrichment Score (ES) | 0.6751478 |
| Normalized Enrichment Score (NES) | 1.6990424 |
| Nominal p-value | 0.001858736 |
| FDR q-value | 0.32268262 |
| FWER p-Value | 0.65 |
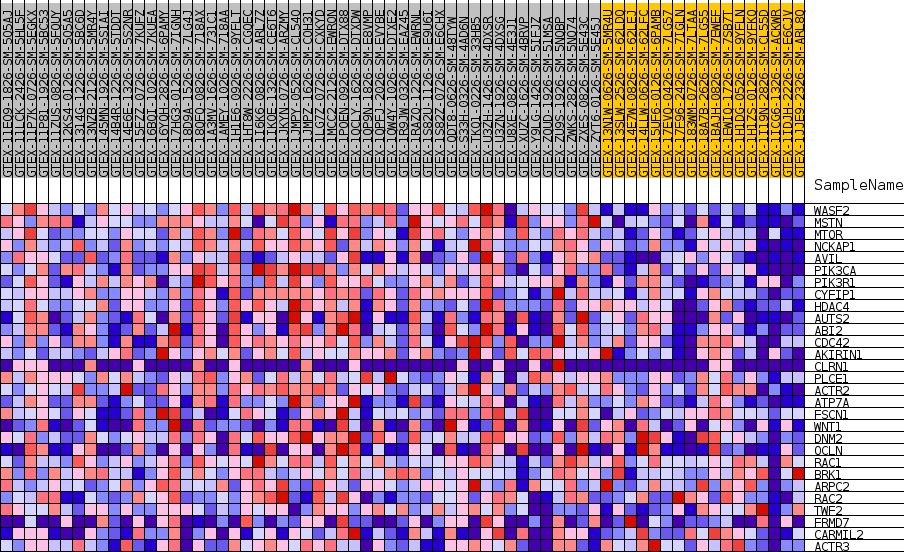
| SYMBOL | TITLE | RANK IN GENE LIST | RANK METRIC SCORE | RUNNING ES | CORE ENRICHMENT | |
|---|---|---|---|---|---|---|
| 1 | WASF2 | NA | 37 | 0.784 | 0.1084 | Yes |
| 2 | MSTN | NA | 238 | 0.657 | 0.1960 | Yes |
| 3 | MTOR | NA | 355 | 0.623 | 0.2806 | Yes |
| 4 | NCKAP1 | NA | 1748 | 0.473 | 0.3208 | Yes |
| 5 | AVIL | NA | 2444 | 0.433 | 0.3683 | Yes |
| 6 | PIK3CA | NA | 2652 | 0.424 | 0.4235 | Yes |
| 7 | PIK3R1 | NA | 2739 | 0.420 | 0.4804 | Yes |
| 8 | CYFIP1 | NA | 3310 | 0.398 | 0.5253 | Yes |
| 9 | HDAC4 | NA | 3944 | 0.376 | 0.5659 | Yes |
| 10 | AUTS2 | NA | 6705 | 0.305 | 0.5577 | Yes |
| 11 | ABI2 | NA | 7092 | 0.297 | 0.5919 | Yes |
| 12 | CDC42 | NA | 9447 | 0.254 | 0.5841 | Yes |
| 13 | AKIRIN1 | NA | 10732 | 0.233 | 0.5929 | Yes |
| 14 | CLRN1 | NA | 10797 | 0.232 | 0.6240 | Yes |
| 15 | PLCE1 | NA | 11513 | 0.221 | 0.6417 | Yes |
| 16 | ACTR2 | NA | 12288 | 0.211 | 0.6568 | Yes |
| 17 | ATP7A | NA | 12830 | 0.203 | 0.6751 | Yes |
| 18 | FSCN1 | NA | 21359 | 0.095 | 0.5321 | No |
| 19 | WNT1 | NA | 21924 | 0.089 | 0.5342 | No |
| 20 | DNM2 | NA | 23515 | 0.072 | 0.5150 | No |
| 21 | OCLN | NA | 24346 | 0.064 | 0.5086 | No |
| 22 | RAC1 | NA | 24971 | 0.058 | 0.5052 | No |
| 23 | BRK1 | NA | 28713 | 0.028 | 0.4405 | No |
| 24 | ARPC2 | NA | 31215 | 0.014 | 0.3967 | No |
| 25 | RAC2 | NA | 32687 | 0.008 | 0.3708 | No |
| 26 | TWF2 | NA | 39570 | -0.006 | 0.2455 | No |
| 27 | FRMD7 | NA | 40211 | -0.014 | 0.2358 | No |
| 28 | CARMIL2 | NA | 44795 | -0.073 | 0.1620 | No |
| 29 | ACTR3 | NA | 48033 | -0.126 | 0.1202 | No |