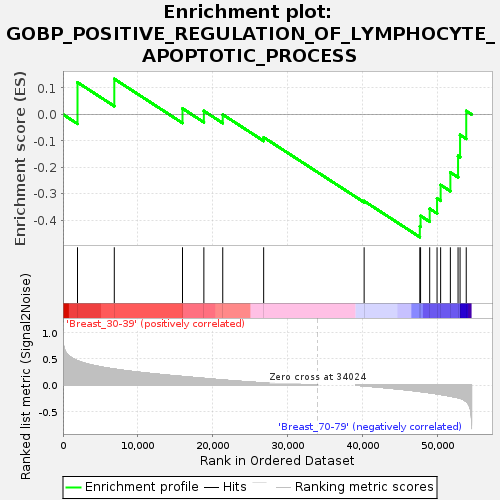
Profile of the Running ES Score & Positions of GeneSet Members on the Rank Ordered List
| Dataset | Breast.Breast.cls #Breast_30-39_versus_Breast_70-79.Breast.cls #Breast_30-39_versus_Breast_70-79_repos |
| Phenotype | Breast.cls#Breast_30-39_versus_Breast_70-79_repos |
| Upregulated in class | Breast_70-79 |
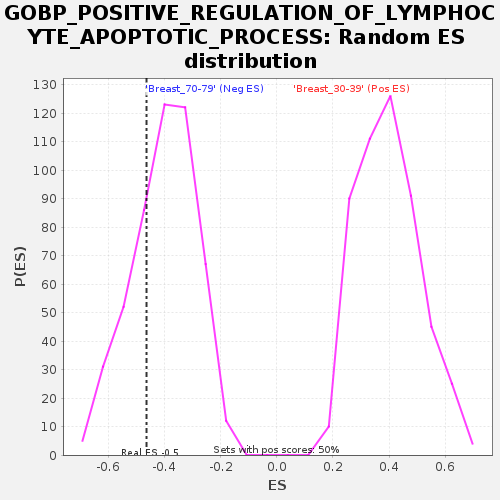
| GeneSet | GOBP_POSITIVE_REGULATION_OF_LYMPHOCYTE_APOPTOTIC_PROCESS |
| Enrichment Score (ES) | -0.46388596 |
| Normalized Enrichment Score (NES) | -1.1606259 |
| Nominal p-value | 0.27309236 |
| FDR q-value | 1.0 |
| FWER p-Value | 0.999 |
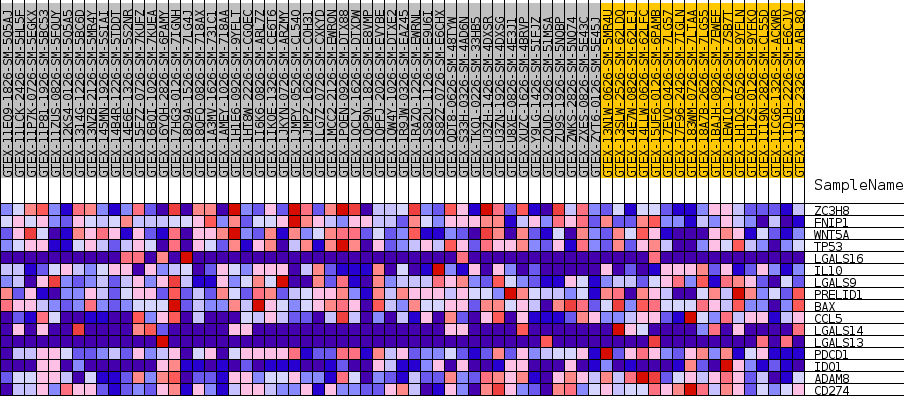
| SYMBOL | TITLE | RANK IN GENE LIST | RANK METRIC SCORE | RUNNING ES | CORE ENRICHMENT | |
|---|---|---|---|---|---|---|
| 1 | ZC3H8 | NA | 1938 | 0.459 | 0.1213 | No |
| 2 | FNIP1 | NA | 6853 | 0.302 | 0.1343 | No |
| 3 | WNT5A | NA | 15967 | 0.162 | 0.0225 | No |
| 4 | TP53 | NA | 18821 | 0.126 | 0.0133 | No |
| 5 | LGALS16 | NA | 21344 | 0.096 | -0.0003 | No |
| 6 | IL10 | NA | 26811 | 0.041 | -0.0866 | No |
| 7 | LGALS9 | NA | 40236 | -0.015 | -0.3276 | No |
| 8 | PRELID1 | NA | 47676 | -0.120 | -0.4231 | Yes |
| 9 | BAX | NA | 47777 | -0.121 | -0.3835 | Yes |
| 10 | CCL5 | NA | 48995 | -0.145 | -0.3565 | Yes |
| 11 | LGALS14 | NA | 49980 | -0.166 | -0.3179 | Yes |
| 12 | LGALS13 | NA | 50457 | -0.176 | -0.2666 | Yes |
| 13 | PDCD1 | NA | 51758 | -0.209 | -0.2192 | Yes |
| 14 | IDO1 | NA | 52785 | -0.237 | -0.1570 | Yes |
| 15 | ADAM8 | NA | 53053 | -0.248 | -0.0773 | Yes |
| 16 | CD274 | NA | 53878 | -0.309 | 0.0131 | Yes |