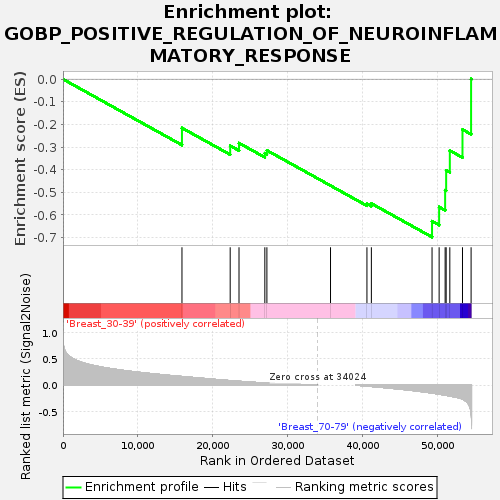
Profile of the Running ES Score & Positions of GeneSet Members on the Rank Ordered List
| Dataset | Breast.Breast.cls #Breast_30-39_versus_Breast_70-79.Breast.cls #Breast_30-39_versus_Breast_70-79_repos |
| Phenotype | Breast.cls#Breast_30-39_versus_Breast_70-79_repos |
| Upregulated in class | Breast_70-79 |
| GeneSet | GOBP_POSITIVE_REGULATION_OF_NEUROINFLAMMATORY_RESPONSE |
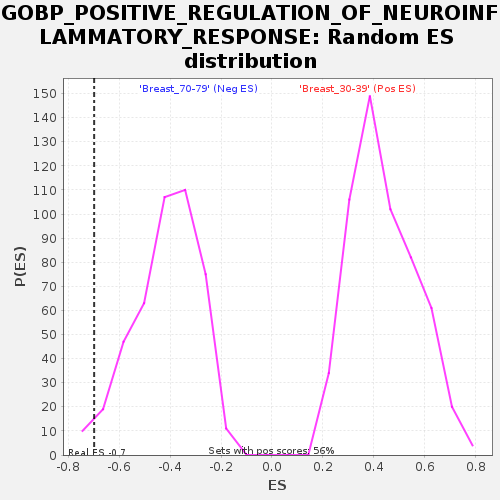
| Enrichment Score (ES) | -0.69790405 |
| Normalized Enrichment Score (NES) | -1.6850849 |
| Nominal p-value | 0.024886878 |
| FDR q-value | 0.49617118 |
| FWER p-Value | 0.724 |
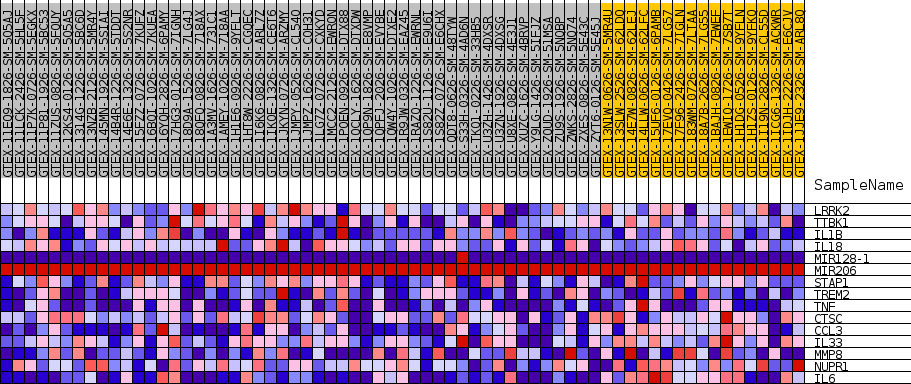
| SYMBOL | TITLE | RANK IN GENE LIST | RANK METRIC SCORE | RUNNING ES | CORE ENRICHMENT | |
|---|---|---|---|---|---|---|
| 1 | LRRK2 | NA | 15895 | 0.163 | -0.2155 | No |
| 2 | TTBK1 | NA | 22338 | 0.085 | -0.2941 | No |
| 3 | IL1B | NA | 23517 | 0.072 | -0.2823 | No |
| 4 | IL18 | NA | 26968 | 0.040 | -0.3271 | No |
| 5 | MIR128-1 | NA | 27243 | 0.038 | -0.3146 | No |
| 6 | MIR206 | NA | 35744 | 0.000 | -0.4704 | No |
| 7 | STAP1 | NA | 40610 | -0.019 | -0.5507 | No |
| 8 | TREM2 | NA | 41202 | -0.026 | -0.5494 | No |
| 9 | TNF | NA | 49309 | -0.151 | -0.6275 | Yes |
| 10 | CTSC | NA | 50256 | -0.172 | -0.5648 | Yes |
| 11 | CCL3 | NA | 51058 | -0.191 | -0.4908 | Yes |
| 12 | IL33 | NA | 51195 | -0.194 | -0.4029 | Yes |
| 13 | MMP8 | NA | 51685 | -0.207 | -0.3153 | Yes |
| 14 | NUPR1 | NA | 53377 | -0.266 | -0.2225 | Yes |
| 15 | IL6 | NA | 54527 | -0.525 | 0.0012 | Yes |