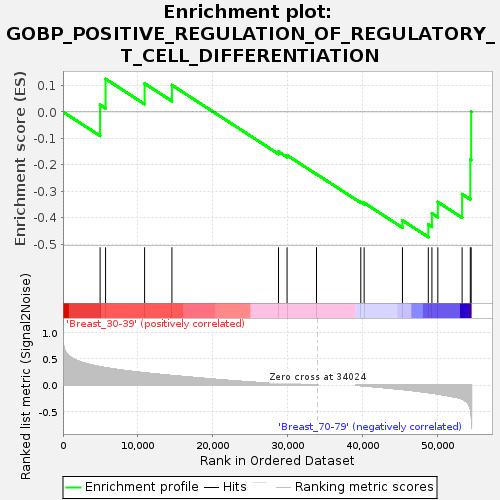
Profile of the Running ES Score & Positions of GeneSet Members on the Rank Ordered List
| Dataset | Breast.Breast.cls #Breast_30-39_versus_Breast_70-79.Breast.cls #Breast_30-39_versus_Breast_70-79_repos |
| Phenotype | Breast.cls#Breast_30-39_versus_Breast_70-79_repos |
| Upregulated in class | Breast_70-79 |
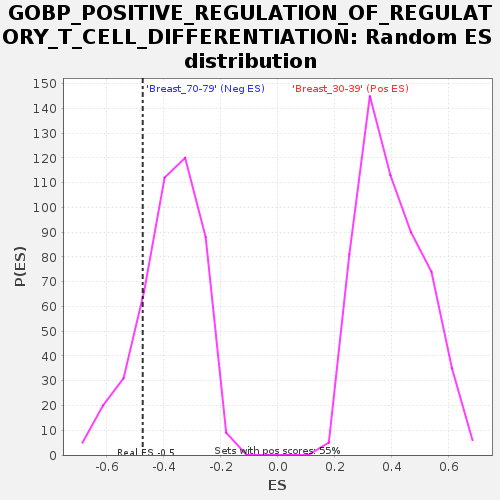
| GeneSet | GOBP_POSITIVE_REGULATION_OF_REGULATORY_T_CELL_DIFFERENTIATION |
| Enrichment Score (ES) | -0.47359446 |
| Normalized Enrichment Score (NES) | -1.2512696 |
| Nominal p-value | 0.16629712 |
| FDR q-value | 1.0 |
| FWER p-Value | 0.998 |
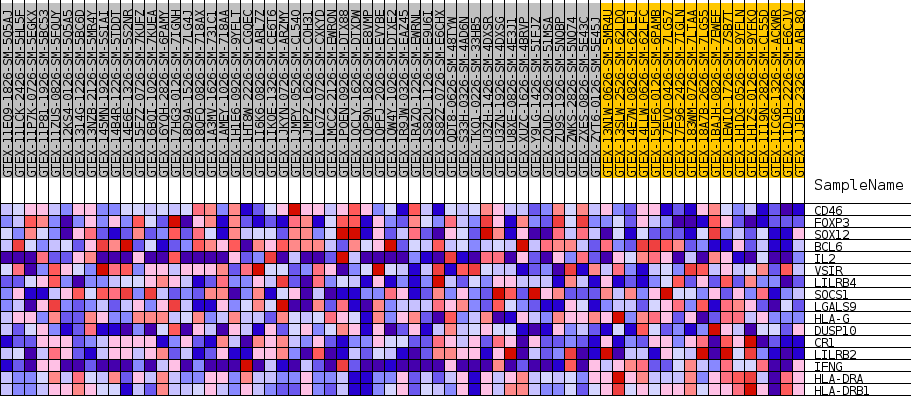
| SYMBOL | TITLE | RANK IN GENE LIST | RANK METRIC SCORE | RUNNING ES | CORE ENRICHMENT | |
|---|---|---|---|---|---|---|
| 1 | CD46 | NA | 4958 | 0.347 | 0.0268 | No |
| 2 | FOXP3 | NA | 5687 | 0.328 | 0.1247 | No |
| 3 | SOX12 | NA | 10903 | 0.230 | 0.1073 | No |
| 4 | BCL6 | NA | 14553 | 0.179 | 0.1014 | No |
| 5 | IL2 | NA | 28793 | 0.028 | -0.1502 | No |
| 6 | VSIR | NA | 29938 | 0.021 | -0.1641 | No |
| 7 | LILRB4 | NA | 33871 | 0.002 | -0.2355 | No |
| 8 | SOCS1 | NA | 39789 | -0.009 | -0.3409 | No |
| 9 | LGALS9 | NA | 40236 | -0.015 | -0.3442 | No |
| 10 | HLA-G | NA | 45353 | -0.081 | -0.4103 | No |
| 11 | DUSP10 | NA | 48809 | -0.140 | -0.4259 | Yes |
| 12 | CR1 | NA | 49292 | -0.151 | -0.3836 | Yes |
| 13 | LILRB2 | NA | 50082 | -0.168 | -0.3409 | Yes |
| 14 | IFNG | NA | 53327 | -0.263 | -0.3112 | Yes |
| 15 | HLA-DRA | NA | 54422 | -0.444 | -0.1806 | Yes |
| 16 | HLA-DRB1 | NA | 54537 | -0.541 | 0.0010 | Yes |