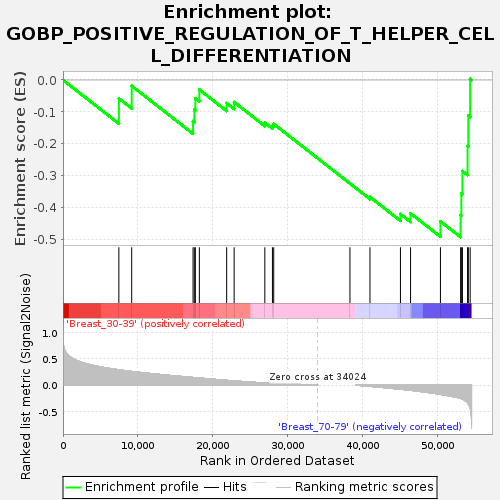
Profile of the Running ES Score & Positions of GeneSet Members on the Rank Ordered List
| Dataset | Breast.Breast.cls #Breast_30-39_versus_Breast_70-79.Breast.cls #Breast_30-39_versus_Breast_70-79_repos |
| Phenotype | Breast.cls#Breast_30-39_versus_Breast_70-79_repos |
| Upregulated in class | Breast_70-79 |
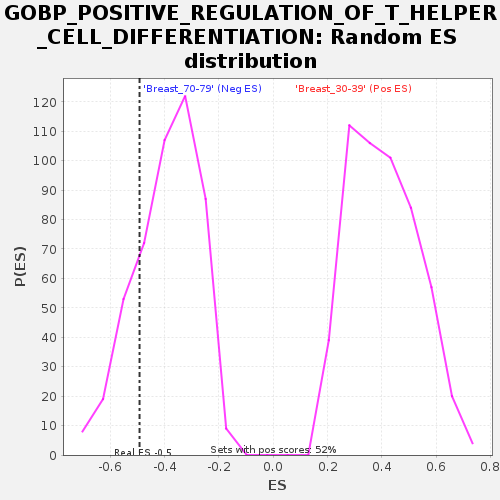
| GeneSet | GOBP_POSITIVE_REGULATION_OF_T_HELPER_CELL_DIFFERENTIATION |
| Enrichment Score (ES) | -0.49240494 |
| Normalized Enrichment Score (NES) | -1.2595733 |
| Nominal p-value | 0.21593292 |
| FDR q-value | 1.0 |
| FWER p-Value | 0.998 |
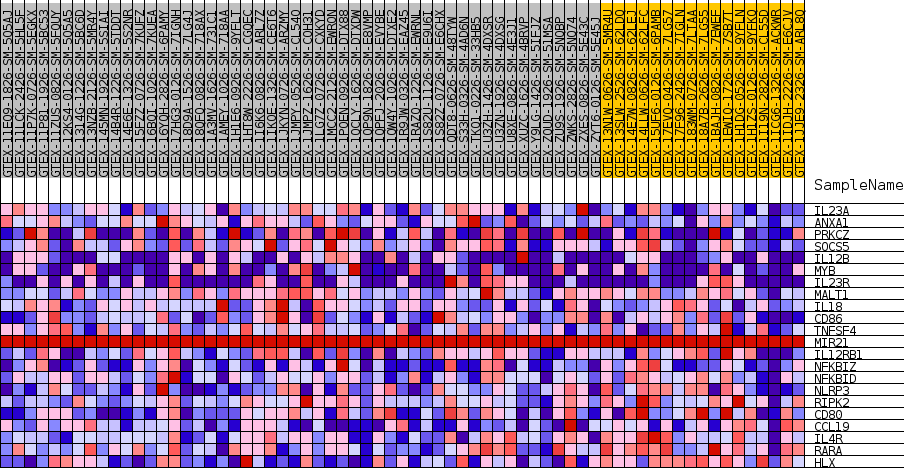
| SYMBOL | TITLE | RANK IN GENE LIST | RANK METRIC SCORE | RUNNING ES | CORE ENRICHMENT | |
|---|---|---|---|---|---|---|
| 1 | IL23A | NA | 7465 | 0.290 | -0.0575 | No |
| 2 | ANXA1 | NA | 9178 | 0.258 | -0.0183 | No |
| 3 | PRKCZ | NA | 17376 | 0.145 | -0.1289 | No |
| 4 | SOCS5 | NA | 17545 | 0.143 | -0.0930 | No |
| 5 | IL12B | NA | 17687 | 0.141 | -0.0571 | No |
| 6 | MYB | NA | 18217 | 0.134 | -0.0301 | No |
| 7 | IL23R | NA | 21868 | 0.090 | -0.0725 | No |
| 8 | MALT1 | NA | 22866 | 0.079 | -0.0692 | No |
| 9 | IL18 | NA | 26968 | 0.040 | -0.1335 | No |
| 10 | CD86 | NA | 27985 | 0.033 | -0.1432 | No |
| 11 | TNFSF4 | NA | 28156 | 0.032 | -0.1377 | No |
| 12 | MIR21 | NA | 38340 | 0.000 | -0.3243 | No |
| 13 | IL12RB1 | NA | 41014 | -0.024 | -0.3667 | No |
| 14 | NFKBIZ | NA | 45087 | -0.078 | -0.4201 | No |
| 15 | NFKBID | NA | 46439 | -0.098 | -0.4179 | No |
| 16 | NLRP3 | NA | 50431 | -0.176 | -0.4430 | Yes |
| 17 | RIPK2 | NA | 53126 | -0.251 | -0.4236 | Yes |
| 18 | CD80 | NA | 53227 | -0.256 | -0.3553 | Yes |
| 19 | CCL19 | NA | 53370 | -0.266 | -0.2852 | Yes |
| 20 | IL4R | NA | 54057 | -0.333 | -0.2065 | Yes |
| 21 | RARA | NA | 54161 | -0.354 | -0.1116 | Yes |
| 22 | HLX | NA | 54405 | -0.436 | 0.0034 | Yes |