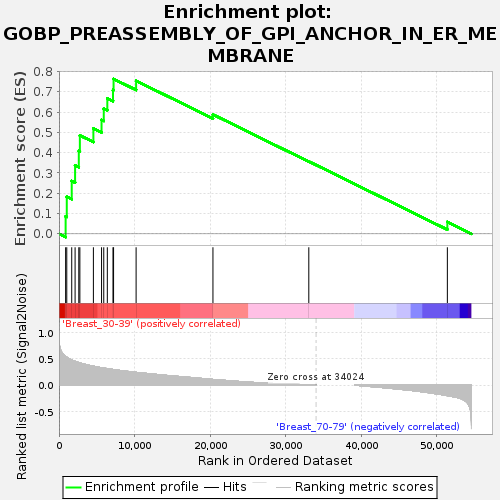
Profile of the Running ES Score & Positions of GeneSet Members on the Rank Ordered List
| Dataset | Breast.Breast.cls #Breast_30-39_versus_Breast_70-79.Breast.cls #Breast_30-39_versus_Breast_70-79_repos |
| Phenotype | Breast.cls#Breast_30-39_versus_Breast_70-79_repos |
| Upregulated in class | Breast_30-39 |
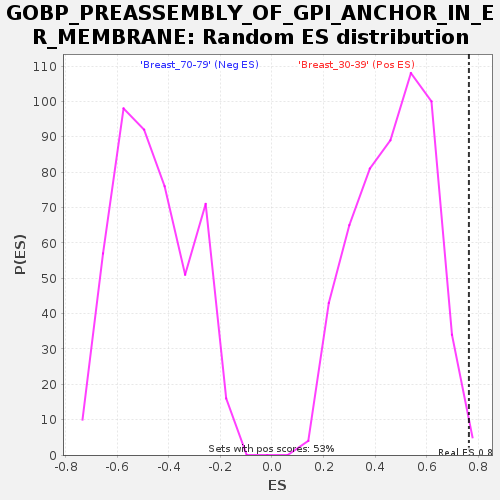
| GeneSet | GOBP_PREASSEMBLY_OF_GPI_ANCHOR_IN_ER_MEMBRANE |
| Enrichment Score (ES) | 0.7634184 |
| Normalized Enrichment Score (NES) | 1.6309952 |
| Nominal p-value | 0.0037807184 |
| FDR q-value | 0.23931776 |
| FWER p-Value | 0.846 |
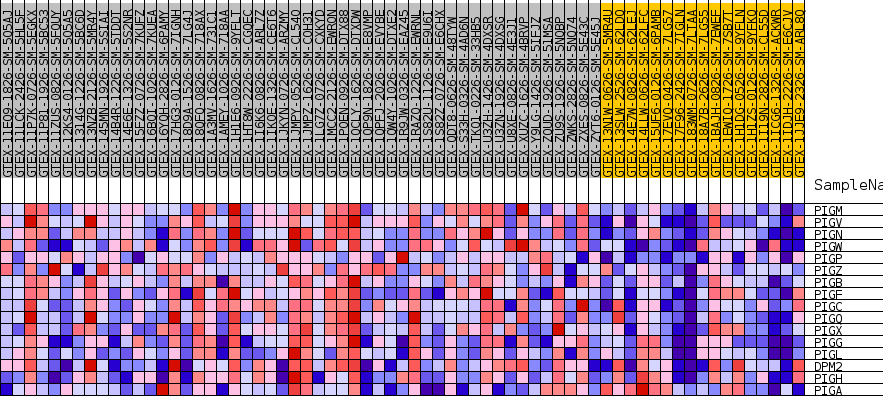
| SYMBOL | TITLE | RANK IN GENE LIST | RANK METRIC SCORE | RUNNING ES | CORE ENRICHMENT | |
|---|---|---|---|---|---|---|
| 1 | PIGM | NA | 877 | 0.543 | 0.0863 | Yes |
| 2 | PIGV | NA | 1029 | 0.528 | 0.1829 | Yes |
| 3 | PIGN | NA | 1685 | 0.477 | 0.2607 | Yes |
| 4 | PIGW | NA | 2130 | 0.449 | 0.3372 | Yes |
| 5 | PIGP | NA | 2621 | 0.426 | 0.4084 | Yes |
| 6 | PIGZ | NA | 2762 | 0.419 | 0.4849 | Yes |
| 7 | PIGB | NA | 4552 | 0.358 | 0.5195 | Yes |
| 8 | PIGF | NA | 5633 | 0.329 | 0.5618 | Yes |
| 9 | PIGC | NA | 5925 | 0.322 | 0.6171 | Yes |
| 10 | PIGQ | NA | 6397 | 0.312 | 0.6672 | Yes |
| 11 | PIGX | NA | 7148 | 0.296 | 0.7093 | Yes |
| 12 | PIGG | NA | 7224 | 0.295 | 0.7634 | Yes |
| 13 | PIGL | NA | 10207 | 0.241 | 0.7542 | No |
| 14 | DPM2 | NA | 20379 | 0.107 | 0.5880 | No |
| 15 | PIGH | NA | 33069 | 0.007 | 0.3567 | No |
| 16 | PIGA | NA | 51410 | -0.200 | 0.0583 | No |