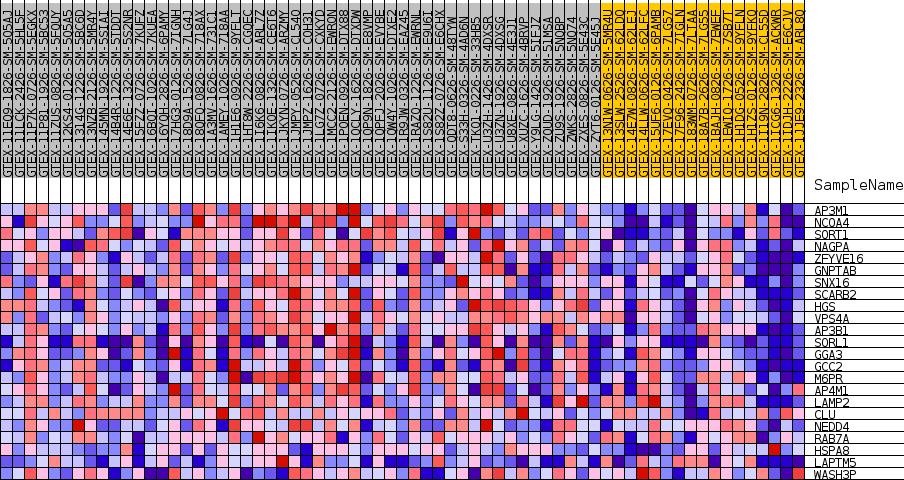
Profile of the Running ES Score & Positions of GeneSet Members on the Rank Ordered List
| Dataset | Breast.Breast.cls #Breast_30-39_versus_Breast_70-79.Breast.cls #Breast_30-39_versus_Breast_70-79_repos |
| Phenotype | Breast.cls#Breast_30-39_versus_Breast_70-79_repos |
| Upregulated in class | Breast_30-39 |
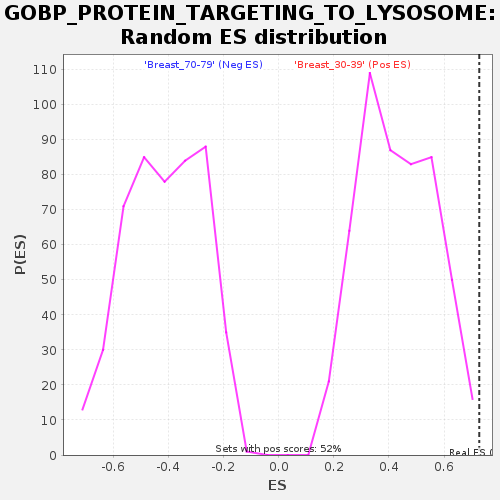
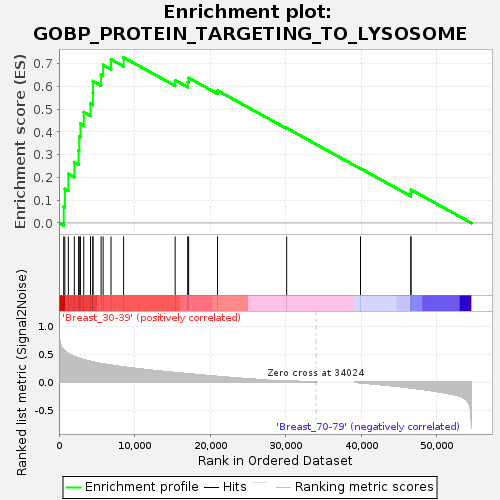
| GeneSet | GOBP_PROTEIN_TARGETING_TO_LYSOSOME |
| Enrichment Score (ES) | 0.7275637 |
| Normalized Enrichment Score (NES) | 1.6952623 |
| Nominal p-value | 0.0019417476 |
| FDR q-value | 0.30672297 |
| FWER p-Value | 0.667 |
| SYMBOL | TITLE | RANK IN GENE LIST | RANK METRIC SCORE | RUNNING ES | CORE ENRICHMENT | |
|---|---|---|---|---|---|---|
| 1 | AP3M1 | NA | 623 | 0.573 | 0.0720 | Yes |
| 2 | NCOA4 | NA | 773 | 0.553 | 0.1499 | Yes |
| 3 | SORT1 | NA | 1238 | 0.509 | 0.2155 | Yes |
| 4 | NAGPA | NA | 2030 | 0.454 | 0.2672 | Yes |
| 5 | ZFYVE16 | NA | 2596 | 0.427 | 0.3191 | Yes |
| 6 | GNPTAB | NA | 2681 | 0.423 | 0.3792 | Yes |
| 7 | SNX16 | NA | 2839 | 0.416 | 0.4369 | Yes |
| 8 | SCARB2 | NA | 3276 | 0.399 | 0.4871 | Yes |
| 9 | HGS | NA | 4170 | 0.369 | 0.5244 | Yes |
| 10 | VPS4A | NA | 4481 | 0.360 | 0.5712 | Yes |
| 11 | AP3B1 | NA | 4493 | 0.360 | 0.6234 | Yes |
| 12 | SORL1 | NA | 5570 | 0.331 | 0.6518 | Yes |
| 13 | GGA3 | NA | 5841 | 0.324 | 0.6941 | Yes |
| 14 | GCC2 | NA | 6886 | 0.301 | 0.7189 | Yes |
| 15 | M6PR | NA | 8553 | 0.269 | 0.7276 | Yes |
| 16 | AP4M1 | NA | 15375 | 0.169 | 0.6272 | No |
| 17 | LAMP2 | NA | 17036 | 0.149 | 0.6184 | No |
| 18 | CLU | NA | 17160 | 0.147 | 0.6376 | No |
| 19 | NEDD4 | NA | 20989 | 0.100 | 0.5820 | No |
| 20 | RAB7A | NA | 30138 | 0.020 | 0.4172 | No |
| 21 | HSPA8 | NA | 39913 | -0.011 | 0.2396 | No |
| 22 | LAPTM5 | NA | 46576 | -0.100 | 0.1322 | No |
| 23 | WASH3P | NA | 46600 | -0.101 | 0.1464 | No |