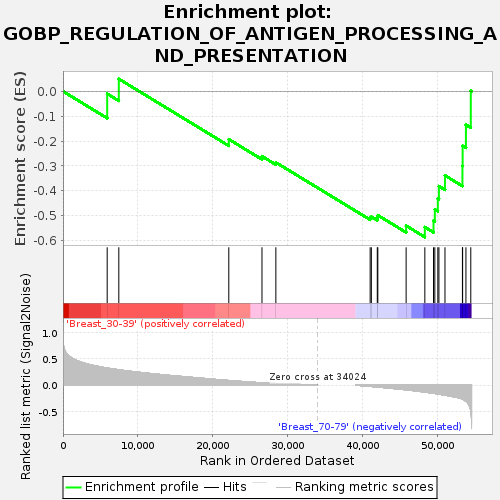
Profile of the Running ES Score & Positions of GeneSet Members on the Rank Ordered List
| Dataset | Breast.Breast.cls #Breast_30-39_versus_Breast_70-79.Breast.cls #Breast_30-39_versus_Breast_70-79_repos |
| Phenotype | Breast.cls#Breast_30-39_versus_Breast_70-79_repos |
| Upregulated in class | Breast_70-79 |
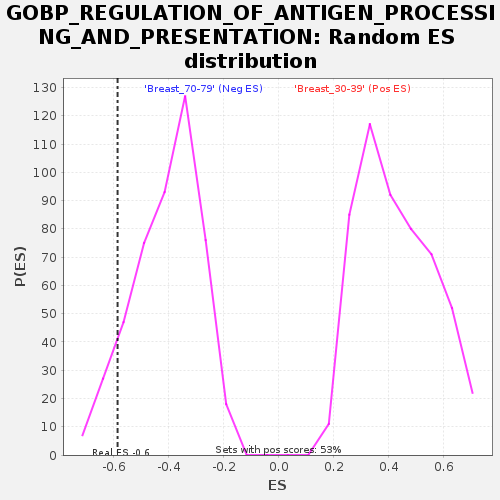
| GeneSet | GOBP_REGULATION_OF_ANTIGEN_PROCESSING_AND_PRESENTATION |
| Enrichment Score (ES) | -0.58659273 |
| Normalized Enrichment Score (NES) | -1.4494832 |
| Nominal p-value | 0.089361705 |
| FDR q-value | 0.80261433 |
| FWER p-Value | 0.978 |
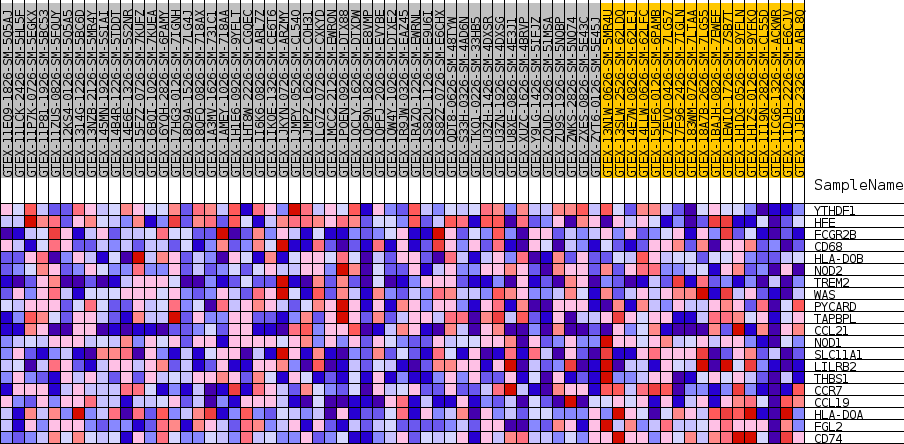
| SYMBOL | TITLE | RANK IN GENE LIST | RANK METRIC SCORE | RUNNING ES | CORE ENRICHMENT | |
|---|---|---|---|---|---|---|
| 1 | YTHDF1 | NA | 5904 | 0.323 | -0.0099 | No |
| 2 | HFE | NA | 7457 | 0.290 | 0.0499 | No |
| 3 | FCGR2B | NA | 22153 | 0.087 | -0.1929 | No |
| 4 | CD68 | NA | 26586 | 0.043 | -0.2612 | No |
| 5 | HLA-DOB | NA | 28441 | 0.030 | -0.2861 | No |
| 6 | NOD2 | NA | 41039 | -0.024 | -0.5095 | No |
| 7 | TREM2 | NA | 41202 | -0.026 | -0.5046 | No |
| 8 | WAS | NA | 41993 | -0.035 | -0.5083 | No |
| 9 | PYCARD | NA | 42066 | -0.036 | -0.4986 | No |
| 10 | TAPBPL | NA | 45846 | -0.089 | -0.5408 | No |
| 11 | CCL21 | NA | 48347 | -0.132 | -0.5465 | Yes |
| 12 | NOD1 | NA | 49505 | -0.155 | -0.5203 | Yes |
| 13 | SLC11A1 | NA | 49682 | -0.159 | -0.4751 | Yes |
| 14 | LILRB2 | NA | 50082 | -0.168 | -0.4311 | Yes |
| 15 | THBS1 | NA | 50228 | -0.171 | -0.3816 | Yes |
| 16 | CCR7 | NA | 51037 | -0.190 | -0.3385 | Yes |
| 17 | CCL19 | NA | 53370 | -0.266 | -0.3003 | Yes |
| 18 | HLA-DOA | NA | 53396 | -0.267 | -0.2194 | Yes |
| 19 | FGL2 | NA | 53837 | -0.305 | -0.1344 | Yes |
| 20 | CD74 | NA | 54486 | -0.487 | 0.0019 | Yes |