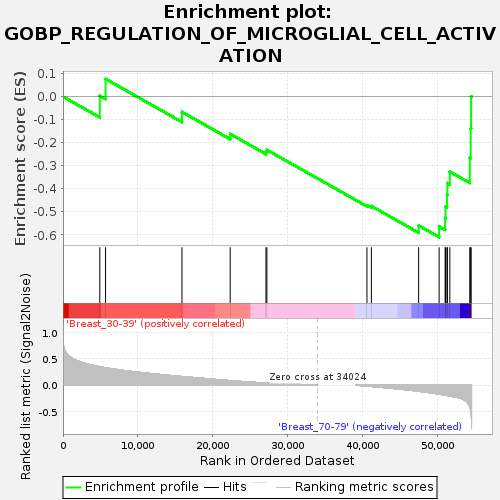
Profile of the Running ES Score & Positions of GeneSet Members on the Rank Ordered List
| Dataset | Breast.Breast.cls #Breast_30-39_versus_Breast_70-79.Breast.cls #Breast_30-39_versus_Breast_70-79_repos |
| Phenotype | Breast.cls#Breast_30-39_versus_Breast_70-79_repos |
| Upregulated in class | Breast_70-79 |
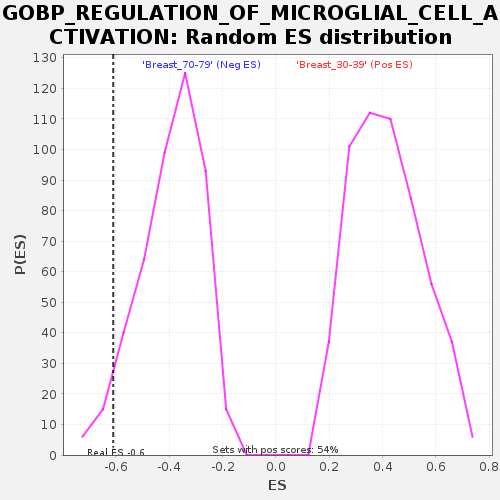
| GeneSet | GOBP_REGULATION_OF_MICROGLIAL_CELL_ACTIVATION |
| Enrichment Score (ES) | -0.60974157 |
| Normalized Enrichment Score (NES) | -1.5466107 |
| Nominal p-value | 0.04595186 |
| FDR q-value | 0.6852124 |
| FWER p-Value | 0.934 |
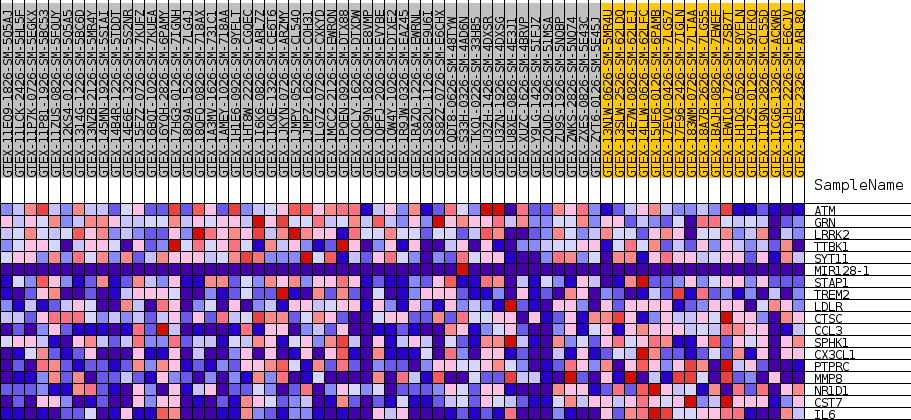
| SYMBOL | TITLE | RANK IN GENE LIST | RANK METRIC SCORE | RUNNING ES | CORE ENRICHMENT | |
|---|---|---|---|---|---|---|
| 1 | ATM | NA | 4915 | 0.348 | 0.0031 | No |
| 2 | GRN | NA | 5685 | 0.328 | 0.0769 | No |
| 3 | LRRK2 | NA | 15895 | 0.163 | -0.0666 | No |
| 4 | TTBK1 | NA | 22338 | 0.085 | -0.1620 | No |
| 5 | SYT11 | NA | 27119 | 0.038 | -0.2392 | No |
| 6 | MIR128-1 | NA | 27243 | 0.038 | -0.2314 | No |
| 7 | STAP1 | NA | 40610 | -0.019 | -0.4713 | No |
| 8 | TREM2 | NA | 41202 | -0.026 | -0.4751 | No |
| 9 | LDLR | NA | 47518 | -0.117 | -0.5596 | No |
| 10 | CTSC | NA | 50256 | -0.172 | -0.5637 | Yes |
| 11 | CCL3 | NA | 51058 | -0.191 | -0.5273 | Yes |
| 12 | SPHK1 | NA | 51119 | -0.192 | -0.4768 | Yes |
| 13 | CX3CL1 | NA | 51304 | -0.197 | -0.4274 | Yes |
| 14 | PTPRC | NA | 51361 | -0.198 | -0.3753 | Yes |
| 15 | MMP8 | NA | 51685 | -0.207 | -0.3257 | Yes |
| 16 | NR1D1 | NA | 54350 | -0.410 | -0.2645 | Yes |
| 17 | CST7 | NA | 54473 | -0.478 | -0.1387 | Yes |
| 18 | IL6 | NA | 54527 | -0.525 | 0.0012 | Yes |