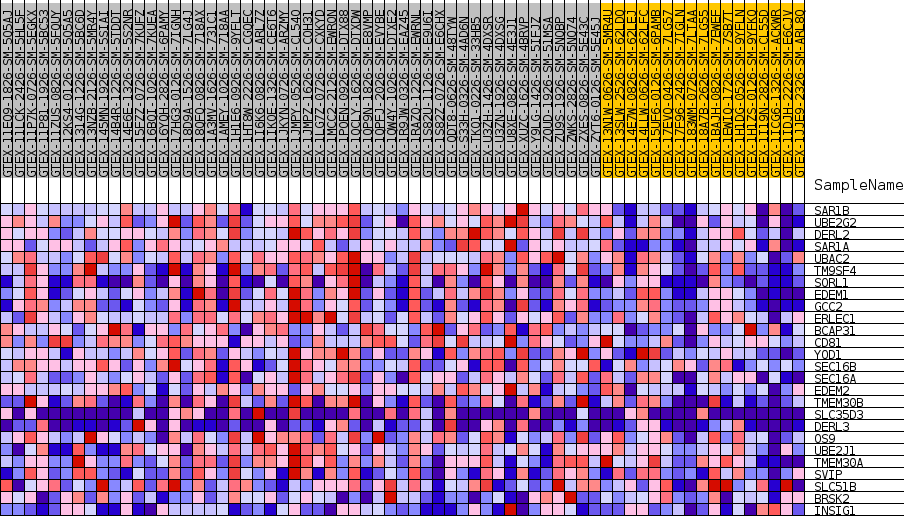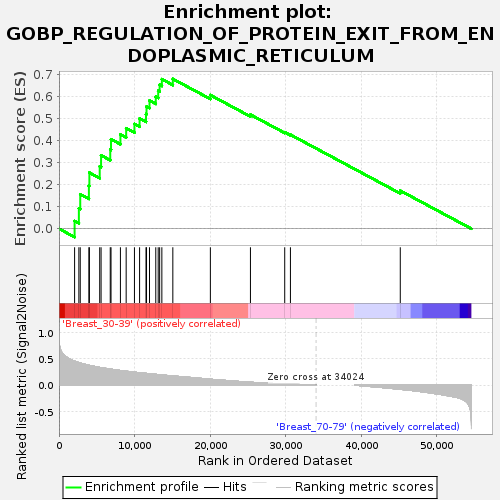
Profile of the Running ES Score & Positions of GeneSet Members on the Rank Ordered List
| Dataset | Breast.Breast.cls #Breast_30-39_versus_Breast_70-79.Breast.cls #Breast_30-39_versus_Breast_70-79_repos |
| Phenotype | Breast.cls#Breast_30-39_versus_Breast_70-79_repos |
| Upregulated in class | Breast_30-39 |
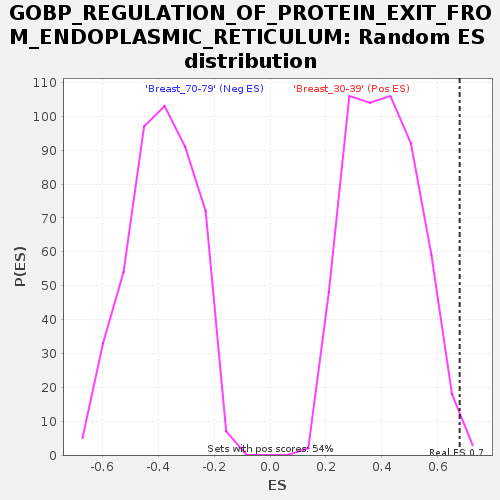
| GeneSet | GOBP_REGULATION_OF_PROTEIN_EXIT_FROM_ENDOPLASMIC_RETICULUM |
| Enrichment Score (ES) | 0.6790648 |
| Normalized Enrichment Score (NES) | 1.6827335 |
| Nominal p-value | 0.007434944 |
| FDR q-value | 0.2962481 |
| FWER p-Value | 0.706 |
| SYMBOL | TITLE | RANK IN GENE LIST | RANK METRIC SCORE | RUNNING ES | CORE ENRICHMENT | |
|---|---|---|---|---|---|---|
| 1 | SAR1B | NA | 2065 | 0.452 | 0.0347 | Yes |
| 2 | UBE2G2 | NA | 2630 | 0.426 | 0.0926 | Yes |
| 3 | DERL2 | NA | 2812 | 0.417 | 0.1562 | Yes |
| 4 | SAR1A | NA | 3957 | 0.375 | 0.1954 | Yes |
| 5 | UBAC2 | NA | 4022 | 0.373 | 0.2542 | Yes |
| 6 | TM9SF4 | NA | 5389 | 0.335 | 0.2829 | Yes |
| 7 | SORL1 | NA | 5570 | 0.331 | 0.3326 | Yes |
| 8 | EDEM1 | NA | 6784 | 0.303 | 0.3591 | Yes |
| 9 | GCC2 | NA | 6886 | 0.301 | 0.4056 | Yes |
| 10 | ERLEC1 | NA | 8130 | 0.276 | 0.4271 | Yes |
| 11 | BCAP31 | NA | 8891 | 0.263 | 0.4554 | Yes |
| 12 | CD81 | NA | 9987 | 0.245 | 0.4746 | Yes |
| 13 | YOD1 | NA | 10668 | 0.234 | 0.4997 | Yes |
| 14 | SEC16B | NA | 11518 | 0.221 | 0.5197 | Yes |
| 15 | SEC16A | NA | 11586 | 0.220 | 0.5538 | Yes |
| 16 | EDEM2 | NA | 11981 | 0.215 | 0.5810 | Yes |
| 17 | TMEM30B | NA | 12811 | 0.203 | 0.5985 | Yes |
| 18 | SLC35D3 | NA | 13131 | 0.199 | 0.6246 | Yes |
| 19 | DERL3 | NA | 13322 | 0.196 | 0.6525 | Yes |
| 20 | OS9 | NA | 13616 | 0.192 | 0.6779 | Yes |
| 21 | UBE2J1 | NA | 15069 | 0.173 | 0.6791 | Yes |
| 22 | TMEM30A | NA | 20038 | 0.111 | 0.6058 | No |
| 23 | SVIP | NA | 25343 | 0.054 | 0.5172 | No |
| 24 | SLC51B | NA | 29881 | 0.021 | 0.4374 | No |
| 25 | BRSK2 | NA | 30636 | 0.017 | 0.4263 | No |
| 26 | INSIG1 | NA | 45178 | -0.079 | 0.1725 | No |