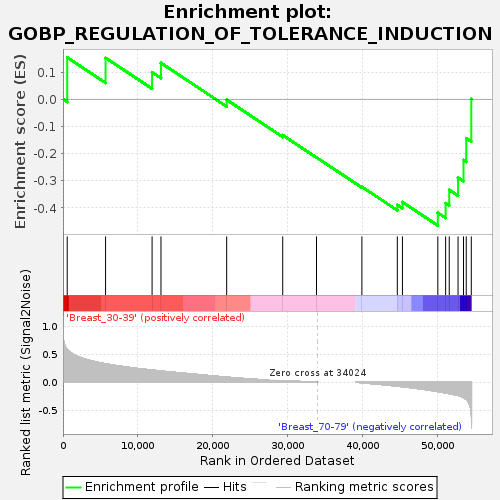
Profile of the Running ES Score & Positions of GeneSet Members on the Rank Ordered List
| Dataset | Breast.Breast.cls #Breast_30-39_versus_Breast_70-79.Breast.cls #Breast_30-39_versus_Breast_70-79_repos |
| Phenotype | Breast.cls#Breast_30-39_versus_Breast_70-79_repos |
| Upregulated in class | Breast_70-79 |
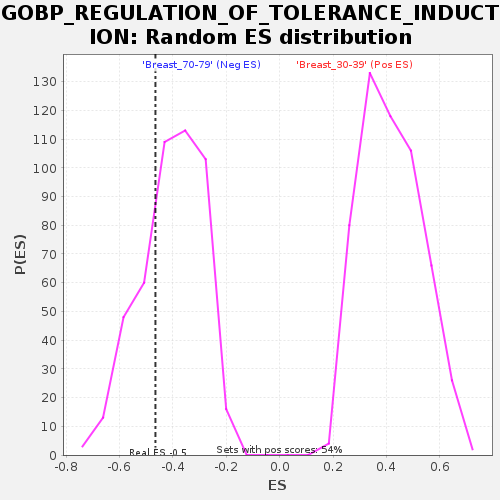
| GeneSet | GOBP_REGULATION_OF_TOLERANCE_INDUCTION |
| Enrichment Score (ES) | -0.46534592 |
| Normalized Enrichment Score (NES) | -1.1452469 |
| Nominal p-value | 0.27741936 |
| FDR q-value | 1.0 |
| FWER p-Value | 0.999 |
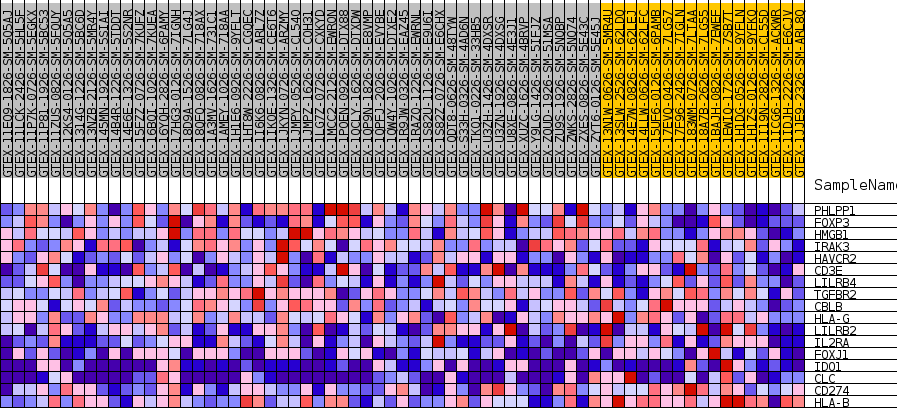
| SYMBOL | TITLE | RANK IN GENE LIST | RANK METRIC SCORE | RUNNING ES | CORE ENRICHMENT | |
|---|---|---|---|---|---|---|
| 1 | PHLPP1 | NA | 563 | 0.583 | 0.1539 | No |
| 2 | FOXP3 | NA | 5687 | 0.328 | 0.1523 | No |
| 3 | HMGB1 | NA | 11903 | 0.216 | 0.0992 | No |
| 4 | IRAK3 | NA | 13090 | 0.200 | 0.1337 | No |
| 5 | HAVCR2 | NA | 21869 | 0.090 | -0.0019 | No |
| 6 | CD3E | NA | 29358 | 0.024 | -0.1324 | No |
| 7 | LILRB4 | NA | 33871 | 0.002 | -0.2145 | No |
| 8 | TGFBR2 | NA | 39937 | -0.011 | -0.3226 | No |
| 9 | CBLB | NA | 44669 | -0.072 | -0.3891 | No |
| 10 | HLA-G | NA | 45353 | -0.081 | -0.3787 | No |
| 11 | LILRB2 | NA | 50082 | -0.168 | -0.4180 | Yes |
| 12 | IL2RA | NA | 51125 | -0.192 | -0.3829 | Yes |
| 13 | FOXJ1 | NA | 51607 | -0.205 | -0.3339 | Yes |
| 14 | IDO1 | NA | 52785 | -0.237 | -0.2887 | Yes |
| 15 | CLC | NA | 53514 | -0.276 | -0.2242 | Yes |
| 16 | CD274 | NA | 53878 | -0.309 | -0.1438 | Yes |
| 17 | HLA-B | NA | 54552 | -0.557 | 0.0007 | Yes |