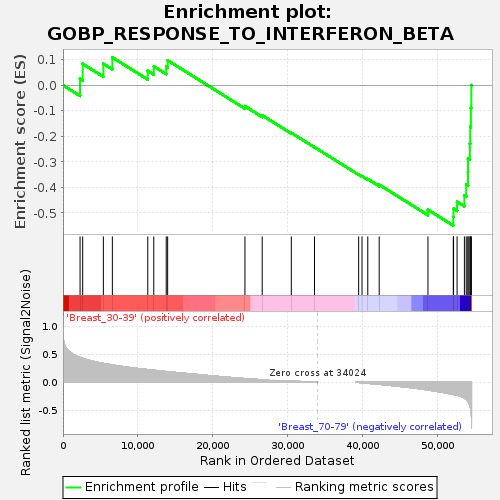
Profile of the Running ES Score & Positions of GeneSet Members on the Rank Ordered List
| Dataset | Breast.Breast.cls #Breast_30-39_versus_Breast_70-79.Breast.cls #Breast_30-39_versus_Breast_70-79_repos |
| Phenotype | Breast.cls#Breast_30-39_versus_Breast_70-79_repos |
| Upregulated in class | Breast_70-79 |
| GeneSet | GOBP_RESPONSE_TO_INTERFERON_BETA |
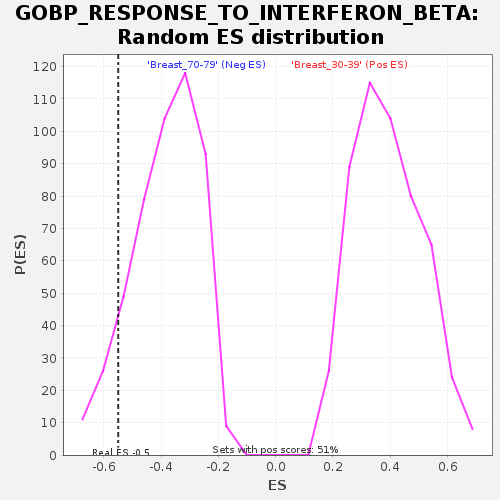
| Enrichment Score (ES) | -0.5495145 |
| Normalized Enrichment Score (NES) | -1.4372214 |
| Nominal p-value | 0.09406953 |
| FDR q-value | 0.8107135 |
| FWER p-Value | 0.979 |
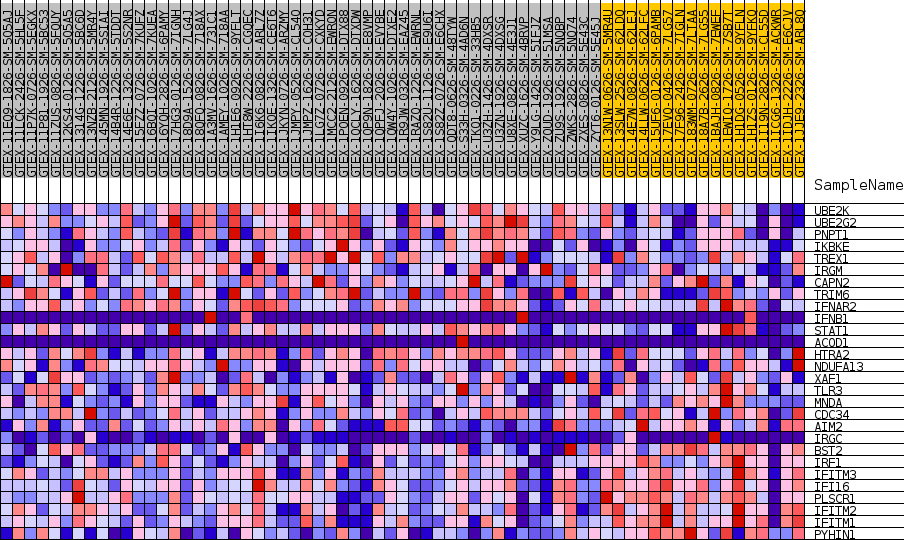
| SYMBOL | TITLE | RANK IN GENE LIST | RANK METRIC SCORE | RUNNING ES | CORE ENRICHMENT | |
|---|---|---|---|---|---|---|
| 1 | UBE2K | NA | 2279 | 0.441 | 0.0255 | No |
| 2 | UBE2G2 | NA | 2630 | 0.426 | 0.0839 | No |
| 3 | PNPT1 | NA | 5392 | 0.335 | 0.0843 | No |
| 4 | IKBKE | NA | 6595 | 0.307 | 0.1090 | No |
| 5 | TREX1 | NA | 11326 | 0.224 | 0.0565 | No |
| 6 | IRGM | NA | 12128 | 0.213 | 0.0743 | No |
| 7 | CAPN2 | NA | 13794 | 0.190 | 0.0726 | No |
| 8 | TRIM6 | NA | 13983 | 0.187 | 0.0976 | No |
| 9 | IFNAR2 | NA | 24309 | 0.064 | -0.0819 | No |
| 10 | IFNB1 | NA | 26615 | 0.042 | -0.1177 | No |
| 11 | STAT1 | NA | 30505 | 0.018 | -0.1862 | No |
| 12 | ACOD1 | NA | 33605 | 0.004 | -0.2425 | No |
| 13 | HTRA2 | NA | 39504 | -0.005 | -0.3498 | No |
| 14 | NDUFA13 | NA | 39953 | -0.011 | -0.3563 | No |
| 15 | XAF1 | NA | 40723 | -0.020 | -0.3673 | No |
| 16 | TLR3 | NA | 42249 | -0.039 | -0.3893 | No |
| 17 | MNDA | NA | 48763 | -0.140 | -0.4875 | No |
| 18 | CDC34 | NA | 52150 | -0.219 | -0.5162 | Yes |
| 19 | AIM2 | NA | 52182 | -0.220 | -0.4832 | Yes |
| 20 | IRGC | NA | 52655 | -0.233 | -0.4564 | Yes |
| 21 | BST2 | NA | 53631 | -0.285 | -0.4308 | Yes |
| 22 | IRF1 | NA | 53876 | -0.309 | -0.3882 | Yes |
| 23 | IFITM3 | NA | 54111 | -0.345 | -0.3400 | Yes |
| 24 | IFI16 | NA | 54119 | -0.346 | -0.2874 | Yes |
| 25 | PLSCR1 | NA | 54364 | -0.417 | -0.2284 | Yes |
| 26 | IFITM2 | NA | 54412 | -0.438 | -0.1625 | Yes |
| 27 | IFITM1 | NA | 54497 | -0.495 | -0.0887 | Yes |
| 28 | PYHIN1 | NA | 54564 | -0.593 | 0.0005 | Yes |