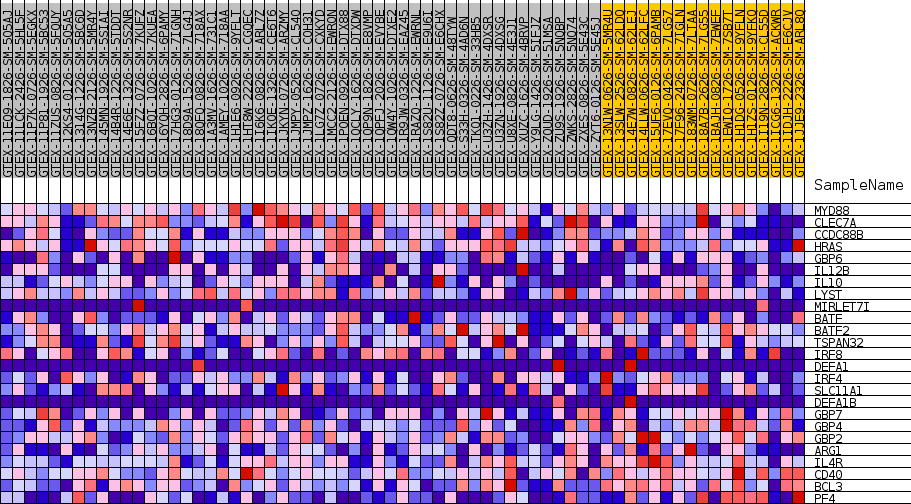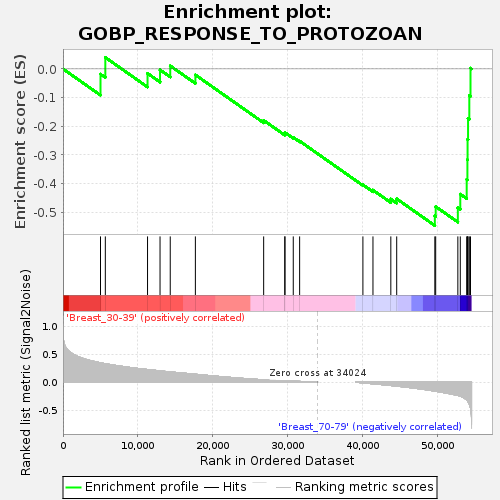
Profile of the Running ES Score & Positions of GeneSet Members on the Rank Ordered List
| Dataset | Breast.Breast.cls #Breast_30-39_versus_Breast_70-79.Breast.cls #Breast_30-39_versus_Breast_70-79_repos |
| Phenotype | Breast.cls#Breast_30-39_versus_Breast_70-79_repos |
| Upregulated in class | Breast_70-79 |
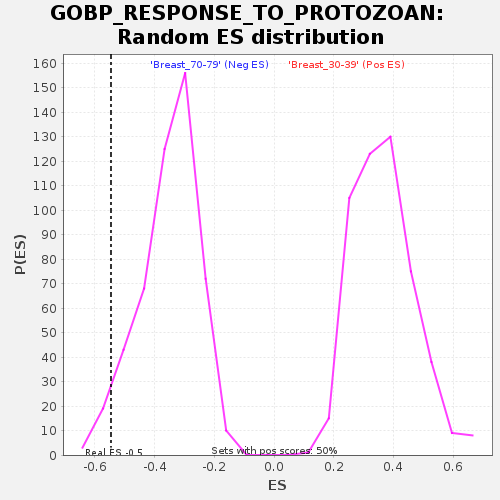
| GeneSet | GOBP_RESPONSE_TO_PROTOZOAN |
| Enrichment Score (ES) | -0.54629093 |
| Normalized Enrichment Score (NES) | -1.5485045 |
| Nominal p-value | 0.044354837 |
| FDR q-value | 0.7345608 |
| FWER p-Value | 0.93 |
| SYMBOL | TITLE | RANK IN GENE LIST | RANK METRIC SCORE | RUNNING ES | CORE ENRICHMENT | |
|---|---|---|---|---|---|---|
| 1 | MYD88 | NA | 5011 | 0.345 | -0.0183 | No |
| 2 | CLEC7A | NA | 5655 | 0.329 | 0.0400 | No |
| 3 | CCDC88B | NA | 11296 | 0.225 | -0.0155 | No |
| 4 | HRAS | NA | 12965 | 0.201 | -0.0032 | No |
| 5 | GBP6 | NA | 14329 | 0.182 | 0.0107 | No |
| 6 | IL12B | NA | 17687 | 0.141 | -0.0208 | No |
| 7 | IL10 | NA | 26811 | 0.041 | -0.1793 | No |
| 8 | LYST | NA | 29633 | 0.022 | -0.2263 | No |
| 9 | MIRLET7I | NA | 29659 | 0.022 | -0.2220 | No |
| 10 | BATF | NA | 30766 | 0.016 | -0.2387 | No |
| 11 | BATF2 | NA | 31618 | 0.013 | -0.2517 | No |
| 12 | TSPAN32 | NA | 40071 | -0.012 | -0.4039 | No |
| 13 | IRF8 | NA | 41415 | -0.028 | -0.4225 | No |
| 14 | DEFA1 | NA | 43802 | -0.059 | -0.4536 | No |
| 15 | IRF4 | NA | 44587 | -0.070 | -0.4529 | No |
| 16 | SLC11A1 | NA | 49682 | -0.159 | -0.5124 | Yes |
| 17 | DEFA1B | NA | 49796 | -0.162 | -0.4800 | Yes |
| 18 | GBP7 | NA | 52757 | -0.236 | -0.4839 | Yes |
| 19 | GBP4 | NA | 53083 | -0.249 | -0.4367 | Yes |
| 20 | GBP2 | NA | 53939 | -0.316 | -0.3851 | Yes |
| 21 | ARG1 | NA | 54035 | -0.331 | -0.3164 | Yes |
| 22 | IL4R | NA | 54057 | -0.333 | -0.2457 | Yes |
| 23 | CD40 | NA | 54122 | -0.346 | -0.1731 | Yes |
| 24 | BCL3 | NA | 54289 | -0.390 | -0.0931 | Yes |
| 25 | PF4 | NA | 54448 | -0.463 | 0.0026 | Yes |