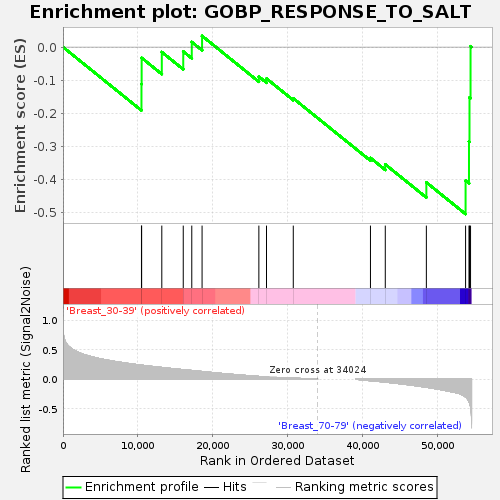
Profile of the Running ES Score & Positions of GeneSet Members on the Rank Ordered List
| Dataset | Breast.Breast.cls #Breast_30-39_versus_Breast_70-79.Breast.cls #Breast_30-39_versus_Breast_70-79_repos |
| Phenotype | Breast.cls#Breast_30-39_versus_Breast_70-79_repos |
| Upregulated in class | Breast_70-79 |
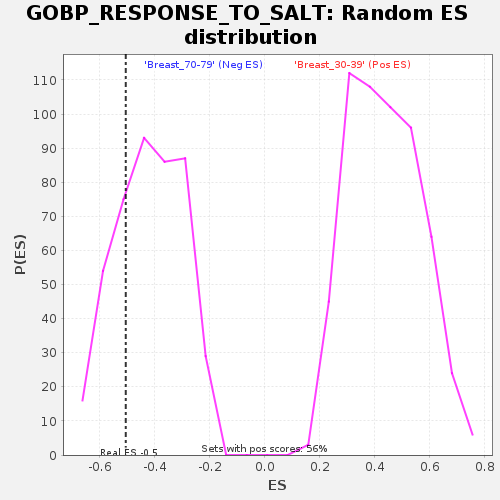
| GeneSet | GOBP_RESPONSE_TO_SALT |
| Enrichment Score (ES) | -0.50622886 |
| Normalized Enrichment Score (NES) | -1.203684 |
| Nominal p-value | 0.2590909 |
| FDR q-value | 1.0 |
| FWER p-Value | 0.998 |
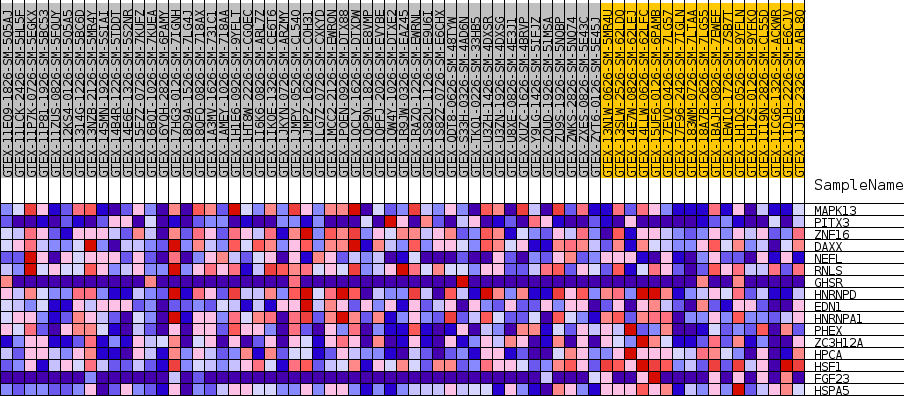
| SYMBOL | TITLE | RANK IN GENE LIST | RANK METRIC SCORE | RUNNING ES | CORE ENRICHMENT | |
|---|---|---|---|---|---|---|
| 1 | MAPK13 | NA | 10484 | 0.237 | -0.1121 | No |
| 2 | PITX3 | NA | 10508 | 0.236 | -0.0327 | No |
| 3 | ZNF16 | NA | 13201 | 0.198 | -0.0151 | No |
| 4 | DAXX | NA | 16067 | 0.161 | -0.0133 | No |
| 5 | NEFL | NA | 17206 | 0.147 | 0.0154 | No |
| 6 | RNLS | NA | 18582 | 0.129 | 0.0339 | No |
| 7 | GHSR | NA | 26170 | 0.046 | -0.0895 | No |
| 8 | HNRNPD | NA | 27190 | 0.038 | -0.0954 | No |
| 9 | EDN1 | NA | 30768 | 0.016 | -0.1554 | No |
| 10 | HNRNPA1 | NA | 41081 | -0.025 | -0.3360 | No |
| 11 | PHEX | NA | 43061 | -0.049 | -0.3555 | No |
| 12 | ZC3H12A | NA | 48550 | -0.136 | -0.4102 | Yes |
| 13 | HPCA | NA | 53791 | -0.300 | -0.4047 | Yes |
| 14 | HSF1 | NA | 54246 | -0.375 | -0.2862 | Yes |
| 15 | FGF23 | NA | 54314 | -0.399 | -0.1527 | Yes |
| 16 | HSPA5 | NA | 54454 | -0.467 | 0.0025 | Yes |